How Long Should You Run Your A/B Test For? Everything You Need To Know About Test Duration
There’s no universal answer to how long you should run an A/B test. It depends on your traffic volume, your MDE, your significance threshold, and your power settings.
That said, Kateryna Berestneva recommends waiting for a minimum of 100 conversions per variation and at least 95% statistical significance, which in her experience translates to four to six weeks.
Sadie Neve recommends mapping your traffic volumes and baseline performance across your site before committing to any test, so you’re only designing experiments your traffic can actually support. And Gerda Thomas suggests using a test duration calculator to remove the guesswork entirely.
The one thing all three agree on: calculate your duration before you start, commit to it, and don’t stop early.
What is test duration?
Test duration is the amount of time you run an A/B test from start to finish, from the moment traffic starts splitting to when you call a winner (or stop the test).
Test duration is important in experimentation because it’s the acid test of whether a hypothesis is even worth pursuing right now. Before you write a single line of test code, a duration estimate tells you whether your idea is feasible given your current traffic, your minimum detectable effect, and your business timeline.
For example, if the math says you need 14 weeks to reach significance on a change that affects 3% of your homepage visitors, that’s a signal to rethink the hypothesis entirely. Either you’re targeting too small a segment, the expected effect size is too subtle to detect quickly, or your traffic volume just can’t support that test right now.
Duration shapes your entire backlog
Every test you run is a decision to not run something else. You can’t test everything, so how long each test takes directly controls how many ideas you get to validate in a given quarter.
Say you’re running four concurrent tests, each taking six weeks to complete. That’s roughly two test cycles in a quarter. With tighter duration estimates, you could squeeze in three cycles instead, which means more ideas validated, more decisions made, and a faster-moving program overall.
For teams with limited traffic, fewer visitors usually means longer tests, which means fewer tests per quarter. But it goes beyond just quantity. When test durations stretch, you may start deprioritizing bold, high-risk ideas in favor of changes likely to show results faster.
Why you shouldn’t run a test for too long
The longer a test runs, the easier it gets for the sample to be polluted. Factors like seasonal shifts, returning visitors who’ve already seen a variant, and external events (like a major news cycle or a sudden algorithm change) can creep in and skew your data.
You may have heard that you shouldn’t run a test longer than one business cycle (typically a week), but Ruben, owner at Conversion Ideas, argues that many valid tests run 2 to 4 weeks: “The issue is not the duration itself, but whether the sample stays clean and the conditions remain stable. I prefer to run full business cycles with a max. of 4 weeks. Better 3 weeks with an MDE of 3% than 1 week with an MDE of 10%.”
The longer you keep an inconclusive test running, the harder it becomes to justify to leadership. Pre-test duration calculations tell you upfront whether a result is achievable in a reasonable timeframe, so you’re not stuck running a test past its useful life.
Key concepts to understand before calculating test duration
Before we dive into the statistical concepts without which calculating test duration is impossible, let’s explore the intuitive idea of “resolution” as it applies to Minimum Detectable Effect (MDE) and A/B test duration. Introduced by Ellie Hughes of Eclipse Group in her 2026 blog, resolution talks about the depth of detail of an object that an artist captures on their canvas. More nuanced drawings (higher resolution) take more time, just like detecting finer changes (smaller MDE) requires a larger sample size.
The analogy supplements the often unfriendly statistical rules that apply to traditional significance and power calculations, and helps beginner and intermediate testers wrap their heads around the connection between MDE, sample size, and test duration.
- Sample size
This is the number of visitors you need in your test before you can trust the results.
In an A/B test, traffic is split between the control and the variant, and the more visitors each version gets, the more stable and reliable your conversion rate estimates become. However, with too few visitors, any difference you see between control and variant could just be coincidence.
Say, for example, your variant gets 30 visitors and six convert. That’s a 20% conversion rate, which sounds great, but with such a small sample, that number isn’t stable enough to rely on. But if you get a 20% conversion rate from 3,000 visitors, you can be much more confident the result reflects a real improvement.
In other words, too small a sample size makes your results look like a fluke, while a large enough sample size ensures the data reflects your actual audience behavior. - Minimum Detectable Effect (MDE)
MDE is the smallest improvement (or “lift”) in your metric that you’d consider meaningful enough to act on.
Say your current conversion rate is 5%. If a 0.5% lift would be enough to justify rolling out a change, then your MDE is 0.5%. But if you’d need to see at least a 2% lift to care, your MDE is 2%. You set it based on what moves the needle for your business.
However, the important question is: what lift is actually realistic for your site? Setting an MDE of 25% might lead you to believe your traffic is sufficient for the test, but if your site has never produced that kind of lift, you’re setting yourself up to run a test that was never going to tell you anything useful.
That said, the smaller your MDE, the harder it is to detect, and the more data you need to spot it with confidence. So, a test targeting a 0.1% lift will need to run significantly longer than one targeting a 2% lift. Setting a realistic MDE upfront, one grounded in your site’s historical performance, prevents your test from running longer than necessary. - Statistical significance
This is a measure of how confident you can be that your results aren’t just a fluke.
Say your variant is outperforming your control by 15%. Statistical significance is what tells you whether that difference is real or whether it just happened by chance. Without it, you could easily make a decision based on a coincidence.
Most teams set their significance threshold at 95%, meaning there’s only a 5% chance the difference you’re seeing between control and variant is random. It doesn’t tell you the effect is big or meaningful, just that it’s likely real. - Power
Power is the probability that your test will detect a real effect if one actually exists. Most teams target 80%, meaning if there’s a true difference between control and variant, the test has an 80% chance of catching it.
May Chin, Product Lead at SuperAI, uses a fishing net analogy to describe statistical power. Picture two nets: one loosely woven with large gaps, the other tightly woven with small gaps. The loose net is ostensibly quicker to build but lets smaller fish slip through, while the tighter net takes more effort but catches everything.
A low-powered test is the loose net; a high-powered test is the tight one.
In May’s words: “A high-powered test—say, with 95% power—can catch even very small fish, meaning it can detect very small effects in your variant. In contrast, a lower-powered test—say, with 60% power—might miss these small fish (or small effects) and incorrectly conclude that there are no meaningful differences between your variant and the control.
In reality, a true effect might exist, but it wasn’t detected because it slipped through the gaps in your net.”
Here’s how expert testers calculate test duration
We asked a few experienced experimenters how they approach test duration calculations, and they had some great insights to share.
Mapping the experimentation landscape first
Sadie Neve, Group Digital Experimentation Manager at Rubix, looks at test duration from two angles: the overall experimentation landscape and the specific experiment at hand.
On the overall level, she says:
Understanding traffic volumes and baseline performance across different areas of the site helps me see where experimentation is viable and how many variants each area can realistically support. This avoids designing tests that will never reach significance because the underlying traffic simply isn’t there.
For individual experiments, she relies on a spreadsheet that takes three inputs: baseline performance, daily traffic to the experimentable area, and significance threshold. It then generates a table of MDEs across different variant counts, making it easy to identify realistic options without defaulting to arbitrary uplift targets.
What’s useful about Sadie’s approach is that it filters out weak hypotheses before a single line of test code gets written. If the traffic isn’t there to support a test, you know before you commit to it.
Using a calculator to speed up the process
Calculating test duration manually is harder than it sounds. That’s why Gerda Thomas, co-founder at Koalatative, built a pre-test calculator with built-in parameters. You enter your weekly traffic and conversions for the page being tested, and the calculator sets the parameters and tells you how long to run the test.
Calculators like this take the guesswork out of the process. Instead of working through the math yourself, you get a clear, defensible number you can use to plan your backlog.
Setting a conversion threshold
Kateryna Berestneva, CRO Manager at SomebodyDigital, takes a more threshold-based approach:
It depends upon the traffic and conversion type, but usually we wait for not less than 100 conversions per variation at least, plus reaching statistical significance of minimum 95%. However, the test duration should always be defined upfront before launching — based on the expected traffic, and external factors like seasonality or ongoing marketing campaigns. On average, each test runs for a minimum of two weeks, regardless of when significance is reached, to account for weekly behavioral patterns and avoid calling results too early.
The 100 conversions per variation benchmark is a practical minimum, but it can vary depending on the test. A test on a high-traffic landing page might hit that threshold in days, while a test deeper in the funnel — say on a checkout confirmation page — could take weeks to get there just based on the volume of users who reach that point.
The 100 conversions per variation benchmark is a practical minimum, but it can vary depending on the test. A test on a high-traffic landing page might hit that threshold in days, while a test deeper in the funnel, say on a checkout confirmation page, could take weeks to get there just based on the volume of users who reach that point.
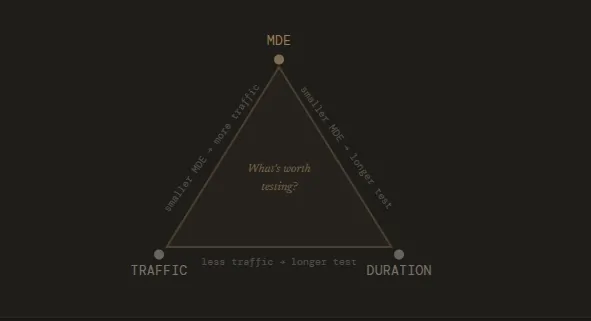
The relationship between sample size, MDE & test duration
Sample size, MDE, and test duration are directly linked. Your MDE determines how large a sample you need, and your sample size determines how long your test needs to run.
A small MDE means you’re trying to detect a subtle change, which requires a larger sample size to confirm it’s real. The larger the sample size you need, the longer your test has to run to collect enough visitors. On the flip side, a higher MDE means you only care about bigger changes, which are easier to detect and require fewer visitors to confirm.
In practice, this means you can influence your test duration by adjusting your MDE. If a test is projected to run for 12 weeks, setting a larger MDE might bring that down to four. The tradeoff, however, is that you won’t get to measure the more subtle changes.
That said, here are some practical tips for keeping your test duration realistic and your results trustworthy.
- Don’t start with a random MDE
Your MDE should be grounded in what’s actually realistic for your site. If historical data shows your conversion rate has never exceeded 3%, expecting a 10% relative lift means you’re banking on an unusually powerful change. It’s not impossible, but it needs to be justified by strong evidence.
Sadie, for example, keeps a running log of actual uplifts from past experiments, grouped by area and by how bold the change was. She says: “Over time, this becomes a calibration tool: instead of picking an MDE in the abstract, you can anchor it to what similar tests have historically achieved. It makes MDE selection far more intuitive and prevents teams from over- or under-estimating what’s realistic.” - Use a test duration calculator
Using a Frequentist calculator like Convert’s Test Duration Calculator can help you determine test duration speedily. You can input your monthly traffic and number of conversions, then check the MDE by day or week based on your chosen significance threshold and power settings.
It takes the math off your plate and gives you a number you can actually plan around. - Let the type of change guide your MDE
The nature of your change matters when choosing your MDE.
Swapping out a menu design is a small, contained change, so the lift is likely to be modest. Rewriting your entire homepage copy, however, is a bigger, bolder move where you’d reasonably expect a more significant difference between control and variant.
Beyond your site’s historical performance, the scope of what you’re testing should directly inform the MDE you set.
In the end, test duration planning really comes down to these three questions:
- What MDE makes the test worth running?
- How much traffic does it need?
- And how many days do you keep it live?
Why is stopping early such a problem?
Stopping a test before it runs its course is a common (and costly) mistake in experimentation. Here’s how Gerda frames it:
Imagine going to see an NBA game. You pay a lot of money for the ticket, get dressed, make a plan to get there, and then after the first team scores once, you determine that’s the team that’s going to win and you walk out.
Pretty silly, isn’t it? A/B testing is kind of the same. There are so many variables to consider: novelty bias, weekday/weekend behavior, and so much more. Having a plan regarding how long your test actually needs to run before pressing play can make a huge difference in your program.
Stopping early is tempting, especially when early results look promising. This is the problem with peeking.
Peeking is when you check your results before the test has reached its predetermined sample size and make a call based on what you see. The issue is that p-values fluctuate throughout a test.
Early on, random variation can make a losing variant look like a winner, or a winning variant look like it’s underperforming. If you stop the moment results look good, you’re essentially cherry-picking a moment in time rather than waiting for a stable result.
The more you peek and the earlier you stop, the more your false positive rate inflates.
Sadie explains the full extent of the damage:
Stopping a test early creates two connected risks: it distorts the statistics and it distorts the long-term direction of your experimentation programme.
Statistically, cutting a test short increases the chance of false positives and false negatives because you’re acting on early-stage noise rather than a stable signal, and even when the direction is right, the effect size is often exaggerated.
At a programme level, those inaccuracies compound: experiments feed your iteration pipeline, shape your roadmap, and calibrate your expectations for future MDEs. If the underlying learnings are wrong or incomplete, you end up prioritising the wrong ideas, shelving concepts that actually had potential, and eroding trust when results don’t replicate.
In short, early stopping doesn’t just jeopardise one experiment, it quietly undermines the foundations of everything that comes after it.
P-hacking follows the same logic. It’s when you keep checking results and stop the test the moment statistical significance is reached, regardless of whether you’ve hit your target sample size.
The p-value says what you want it to say, but the result is just as unreliable as stopping early for any other reason.
Some recommendations if you’re starting out
If you’re newer to A/B testing, here are a few habits we recommend you adopt:
- Run A/A tests first. Before you trust any results coming out of your testing platform, run an A/A test, where both sides show the exact same experience. If your platform is working correctly, you should see no statistically significant difference. If you do, something is off and you need to investigate before running real tests.
- Calculate test duration before you start. Determine upfront how long the test needs to run and commit to it. As we’ve covered, this means knowing your baseline conversion rate, your MDE, your significance threshold, and your desired power. Once you have a duration, treat it as fixed unless something goes seriously wrong with the test itself.
- Assign a neutral monitor. Have someone track the test after deployment for sample ratio mismatch (SRM) and other QA issues, but make sure it’s someone who doesn’t have the authority to call a winner (to prevent bias).
When can a test be (safely) stopped early?
While it’s generally not advisable to stop a test early, there are some fringe situations where it’s the right call.
Ioana Iordache, Founder and Product Growth Consultant at Io Growth Lab, identifies three scenarios where early stopping is acceptable.
- Clear harm detected
If your variant is significantly and consistently hurting the business on primary or secondary metrics, continuing the test isn’t worth it. An example is when test performance is below control or p < 0.05 for three or more consecutive days. At that point, the cost of continuing outweighs any potential learning. - Futility
Sometimes a test has virtually no chance of reaching significance. Conditional power measures the probability that your test will reach significance by the end, given the data collected so far.
If conditional power drops below 20% by day 14, the test is very unlikely to produce a conclusive result, no matter how much longer you run it, so stopping here will save time. - Integrity issues
Both Ioana and Sadie agree that if the test itself is broken or the integrity of the experiment is compromised, the data it produces will be meaningless. For example, a bug in the variant, sample ratio mismatch, or data tracking failures mean that whatever results you’re seeing don’t reflect real user behavior. There’s nothing to learn from a broken test, so you can stop it early if you notice these integrity issues.
Outside of these scenarios, ending a test early undermines the whole point of running it.
As Sadie puts it:
Whether the result is positive or negative, you need the full duration to understand the true effect, capture natural behavioural cycles, and generate insights you can confidently build on. Cutting that short limits your ability to learn and weakens the foundation for future iterations.
How to use the Convert Test Duration Calculator?
Convert’s Test Duration Calculator supports fixed-horizon frequentist statistics, meaning you define the parameters of your test upfront and the calculator tells you exactly how long to run it before you can make a decision.
Here’s how it works.
You start by entering your weekly visitors and conversions for the page being tested, along with the number of variants you’re running. From there, the calculator runs power calculations and spits out a timeframe in weeks.
If you have 50,000 weekly visitors and 10,000 conversions, for example, it might tell you that two weeks is enough to detect a 3% lift. That’s your test window. You set it, commit to it, and avoid touching the results until the time is up.
The MDE you choose is important here. You’re essentially making a bet on the minimum lift that would actually be worth acting on. If your web developer charges a premium to implement a change, a 0.5% lift probably doesn’t justify it. A 3% lift might.
That number is personal to your business and your costs, and it directly determines how long the calculator tells you to run the test.
Once the test window closes, you check the results once. Is the lift at or above your MDE? Is it statistically significant? If yes on both, you have a result you can act on.
If the test runs past your planned duration without reaching significance, the statistics remain valid but it means you’re operating outside your original plan. The calculator’s post-hoc analysis can help you assess where you stand and what you can confidently conclude if you stopped the test at that moment.
The same logic applies if you’re running more than one variant. More variants means more combinations to power, which the calculator accounts for when generating your timeframe.
Run Tests With Confidence Using the Convert Test Duration Calculator
Test duration shapes which hypotheses are worth pursuing, how many tests you can run in a quarter, and whether the decisions you make at the end of a test are actually defensible.
Get it wrong and you’re either stopping tests prematurely and acting on incomplete data, or running them too long and compromising your sample. Neither produces the kind of learning that moves a program forward.
But determining your test duration doesn’t have to be guesswork.
Once you know your baseline conversion rate, your traffic, and the kind of lift worth acting on, you can use the Convert Test Duration Calculator to calculate a duration you can commit to before running your test. Simply plug in your numbers and the tool will do the rest.
FAQs
- Can I run multiple tests simultaneously without affecting test duration?
Yes, but with some caveats. Running concurrent tests on different pages or different parts of the same page is generally fine. The risk comes when tests overlap on the same audience or the same conversion goal.
In that case, one test can influence the results of another, making it harder to isolate what actually caused a change. If you’re running concurrent tests, make sure your audience segments are cleanly separated and your primary metrics aren’t shared. - How does personalization affect test duration?
Personalization narrows your audience by design, which means smaller segments and fewer visitors per variation. A test that would take two weeks on your full audience might take six weeks on a personalized segment.
Before running tests on personalized experiences, make sure the segment is large enough to support the sample size your MDE requires. If it isn’t, you may need to widen the segment or revisit the hypothesis. - Does test duration change for multivariate tests?
Yes, significantly. In an A/B test, your traffic splits between two variations. In a multivariate test, it splits across multiple combinations, which means each combination gets a smaller slice of your traffic.
The more combinations you’re testing, the longer the test needs to run to collect enough data per combination. This is why multivariate testing is often impractical for low-traffic websites. - How does seasonality affect test duration planning?
If your business has predictable seasonal peaks, like a retail site ahead of the holidays or a tax platform in Q1, you need to account for that in your planning.
Running a test that overlaps with a seasonal spike can skew your results because your traffic and conversion behavior during that period won’t reflect how your audience normally behaves. Ideally, you either complete the test before the seasonal shift or wait until after it to start. - What should I do if my test reaches significance well before the planned end date?
Let it run. Reaching significance early doesn’t mean the result is stable. It may mean you’ve caught a moment of variance rather than a genuine trend. Calling a winner before your predetermined end date is a form of early stopping, with all the same risks.
Commit to the duration you calculated upfront and use that time to monitor for any anomalies.


Written By
Althea Storm
Edited By
Carmen Apostu
