How to Conduct an A/B Test in 2026
In 2026, easy access to experimentation tools has lowered the barrier to running A/B tests. Execution is now really cheap, and AI can now generate ideas, build variants, write code, and summarize results in seconds.
The competitive edge comes from rigor, transparency, disciplined decision-making, and building a process your team can consistently trust.
What running an A/B test really means in 2026
As markets get more competitive and customer journeys stretch across fragmented channels, companies can’t rely on instinct or one-off campaigns. That’s why, in recent years, A/B testing has shifted from a nice-to-have growth tactic to an everyday necessity for marketers.
Companies like HubSpot are embedding experimentation across their marketing systems, as seen in its Loop framework. While one framework doesn’t define the entire industry, it does reflect the importance of conducting experiments the right way.
What to consider when running A/B tests
Running A/B tests isn’t the difficult part anymore. The hard part is building your experiments on the right foundation. Before you launch your next test, here are two concepts to understand:
1. The GIGO effect
Garbage In, Garbage Out (GIGO) means exactly what it sounds like: if your inputs are weak, your conclusions will be, too. In experimentation, this happens when you build hypotheses on shallow research, messy tracking, or AI outputs that were never validated.
For example, if you use AI-generated buyer personas to run experiments instead of studying your real customers, your test results may optimize for an audience that doesn’t actually exist.
2. Mental models
The way you think about experiments shapes what you learn from them. Mental models guide that thinking by influencing how you frame questions, interpret results, and decide what to do next.
- The scientific method
This is a structured approach to inquiry that involves forming a hypothesis, predicting outcomes, testing those predictions, and comparing results against expectations.
Renowned physicist Richard Feynman puts it like this:
First we guess it; then we compute the consequences of the guess, then we compare the result with the experiment. If it disagrees with the experiment, it is wrong.
- Feedback loops
This is a system where outputs from one cycle become inputs for the next. This ensures that what you learn from past tests directly influences how you design future tests.
As Nils Koppelmann explains:
Optimisation efforts should not aim to prove you are right or wrong, but to determine why. There is no point in optimising anything if you don’t understand how you got there and how to replicate it.
- Probabilistic thinking
This model involves evaluating outcomes in terms of likelihood rather than certainty. Instead of treating results as absolute truths, this model encourages questions like whether a result might change over time, differ across segments, or be influenced by external factors. - Occam’s Razor
This is the principle that, when multiple explanations are possible, the one that relies on the fewest assumptions is often preferable. Running simple tests instead of complicated ones makes it easier to understand what drives the result and makes those learnings easier to reuse in future experiments. - Second-order thinking
This model extends analysis beyond immediate results to consider longer-term effects. Instead of asking only whether a test succeeded or failed, this model asks what the outcome implies for future decisions.
When you should (and should not) run an A/B test
Knowing how to run an A/B test is important, but knowing when a test will actually give you a meaningful answer matters even more.
When you should run an A/B test
You should run an A/B test when:
- You have a clear decision to make. Run a test when the result will determine what ships, such as choosing between two onboarding flows or pricing structures.
- You can isolate a meaningful change. Test focused differences, like a use-case headline versus a feature-led one, so the outcome clearly reflects user preference.
- You have enough traffic and time. High-traffic pages can support tests on copy, layout, or trust signals and reach reliable conclusions within a reasonable window.
- The risk of being wrong is high. If a change could affect revenue, retention, or a core user flow, testing reduces the cost of rolling out the wrong decision.
- You want to challenge assumptions. Use testing to question internal beliefs and validate what users actually respond to, not what you expect them to prefer.
When you should not run an A/B test
A/B testing can slow progress or mislead you when:
- Traffic is too low to support reliable results. If the page only receives a few hundred visits per month, you’ll likely get better insights with qualitative research or expert review.
- You don’t yet understand the core problem. If you’re unclear why users drop off or what they need, do some research, session reviews, or user interviews before running tests.
- The result will not change your decision. If you plan to ship the same version regardless of the outcome, running a test only adds extra work.
- The change could damage trust or cross ethical lines. Experiments that affect pricing fairness or user privacy can cause lasting damage, even if they lift short-term metrics.
The features that matter in an experimentation stack in 2026
Our in-house CRO expert, Marcella Sullivan, surveyed experimenters—spanning in-house teams, agencies, and independent consultants—about what they want from testing platforms.
Eleven responses came in and the recurring themes were: prompt-led workflows, automation for repetitive tasks, cleaner documentation, clear ownership of tests, access to raw data, and stronger integrations.
At the same time, many expressed skepticism toward vendors that overpromise on AI while neglecting usability, transparency, and data access.
The takeaway: The best experimentation platforms aren’t the ones with the flashiest AI features, but the ones that reduce manual effort while still being transparent and trustworthy.
To build an experimentation stack that balances AI capability with human oversight, here are the features to prioritize:
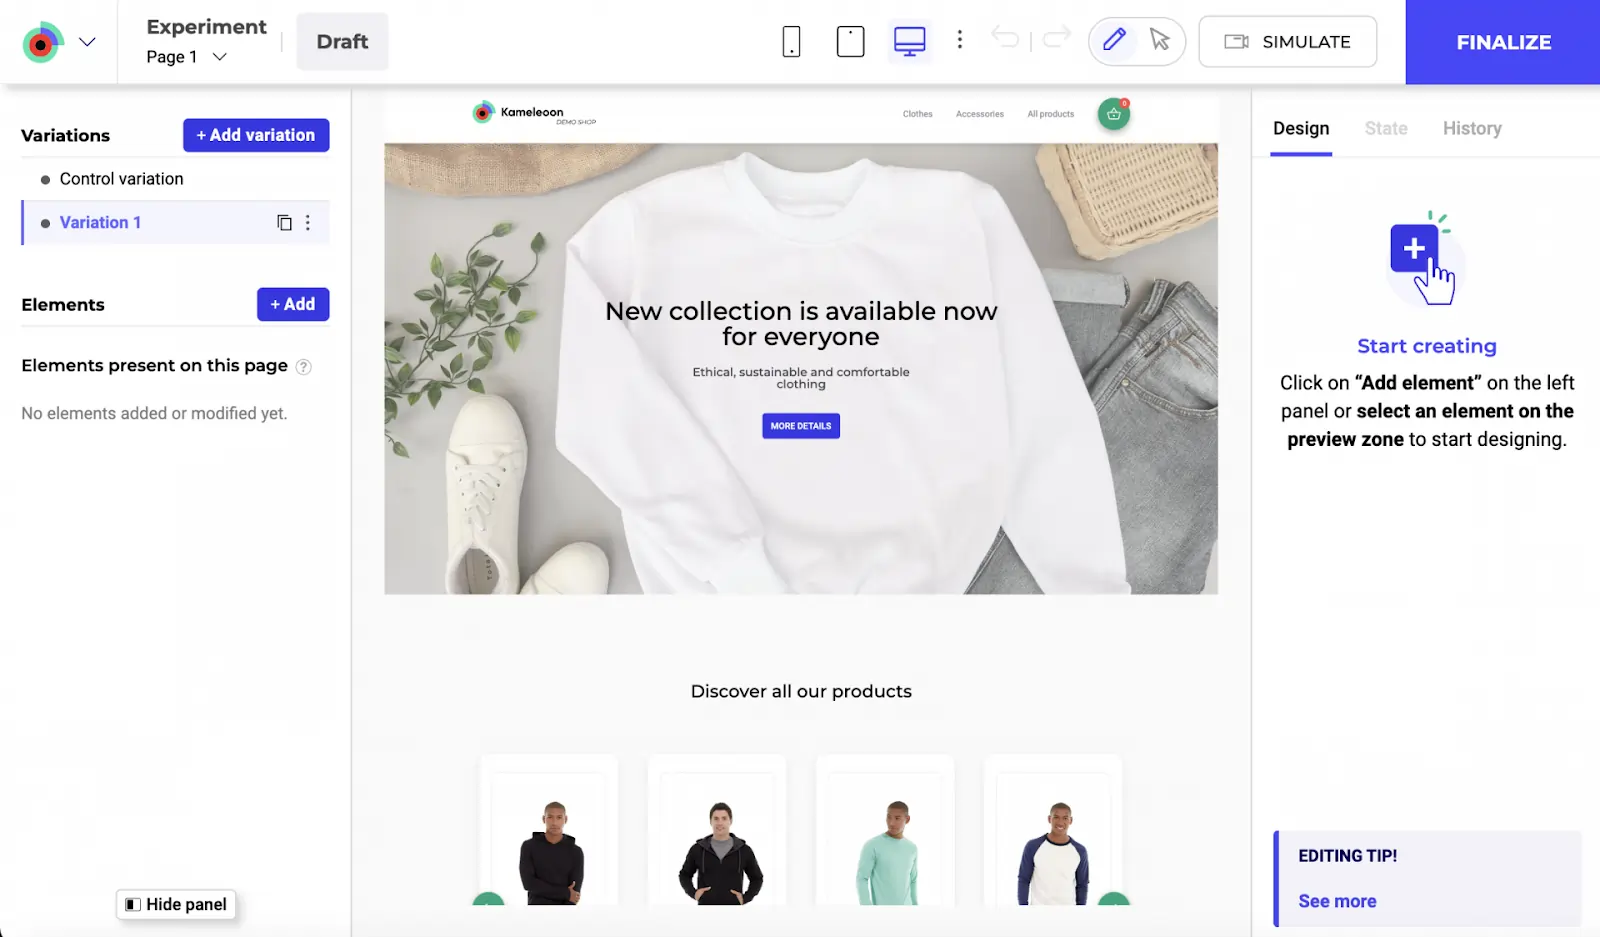
- AI-aided visual editors for fast mockups
AI-powered visual editors, like Kameleeon’s Graphic Editor, let you turn ideas into testable variants quickly without waiting on engineering. You can mockup layouts, adjust copy, or rearrange page elements and launch tests almost immediately by either using the drag-and-drop editor or prompt-based experimentation (PBX).
- Secure access to advanced models and automation
Modern experimentation depends on automation and AI workflows. Deep MCP access allows experimentation data to connect directly to agentic systems while preserving transparency and control.
Convert provides this through its MCP Server, which securely connects AI models like Claude or Cursor to live experimentation data. It allows teams to create experiments, query results, and automate workflows directly from their development environment. - Data segregation
As experimentation scales across regions, teams, and products, data must stay clean. Data segregation ensures that experiment data remains scoped to the right context, so results are not polluted by unrelated traffic, teams, or environments.
In Convert, experiments are separated by site, app, region, or environment, allowing different teams to run parallel tests without interfering with each other’s data. - Bring Your Own Data (BYOD)
BYOD allows you to connect experimentation results to your own source-of-truth systems. This way, your experiments can reference the same revenue, retention, and product metrics your business already uses.
Convert supports BYOD by integrating directly with analytics tools, event pipelines, and data warehouses, so experiment outcomes can be analyzed alongside business KPIs. - Third-party integrations
Experimentation should not live in isolation. Strong third-party integrations ensure that experiment data flows directly into the analytics and data tools your team already relies on.
Convert integrates seamlessly with tools like Google Analytics 4, Segment, Mixpanel, and BigQuery, which means you don’t need to rely on manual exports or custom stitching to understand results. - Granular control over statistical methods and decision logic
Instead of forcing every test into a single default framework, a good experimentation platform allows you to choose statistical methods for each test, define confidence or probability thresholds, and control how decisions are made.
For example, Convert gives experienced teams control over statistical settings while encouraging thoughtful interpretation. This helps you evaluate results objectively before declaring a winner.
How to triangulate data to reach defensible insights
No single data source tells the whole story. So, to decide whether a test is worth running, you need to collect different kinds of data, including:
- Quantitative data
Quantitative data is numerical, objective, and measurable, e.g., conversion rate, bounce rate, and average order value. It tells you what’s happening at scale and provides the statistical backbone for your experiments.
Best for: Detecting statistical significance changes during a test and quantifying the impact of a change on metrics. - Qualitative feedback
Qualitative data is descriptive and subjective, e.g., customer surveys, user interviews, and support tickets. It captures the thoughts, feelings, and motivations of your users, helping you understand why the numbers in your quantitative data look the way they do.
Best for: Uncovering pain points that aren’t visible in a spreadsheet and generating high-quality test hypotheses. - Heatmaps
Heatmap data (often called Behavioral or Visual data) is a graphical representation of user interaction. It shows you how users physically navigate your site: where they look, click, and scroll. Their behavior is depicted by visual “hot” and “cold” spots based on cursor movement or taps.
Best for: Spotting “dead clicks” (users clicking things that aren’t buttons) and seeing if users are actually reaching your Call to Action (CTA).
The goal is to synthesize all these data types, reconcile contradictory findings, and collect sufficient evidence to move forward with a test.
This is called triangulation.
Here’s how Ellie Hughes, the Head of Consulting at the Eclipse Group, approaches triangulation:
I almost think about it as taking a quantitative approach to qual data and a qualitative approach to quant data. Visualize quant data in an easy-to-consume way, and pair qual insights with quant insights that support them.
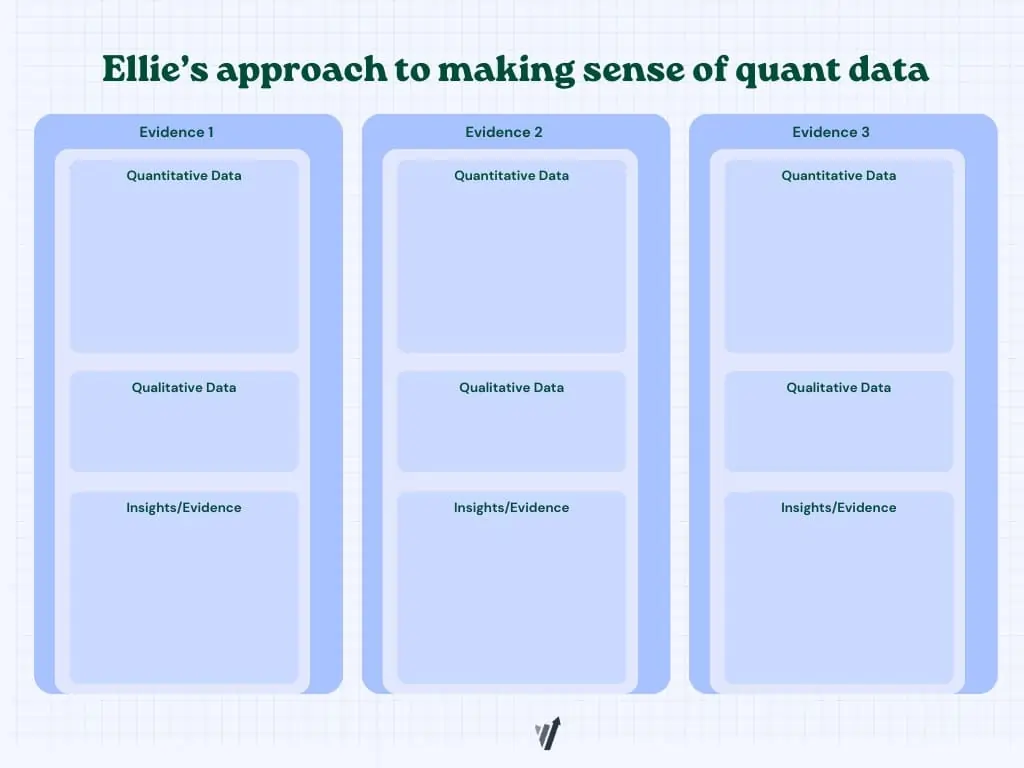
In practice, this might look like:
- Spotting a potential problem in quantitative data (e.g., a sharp drop-off between product views and sign-ups)
- Confirming the problem with qualitative feedback (e.g., user comments pointing to unclear pricing or missing context)
- Visualizing the problem through heatmaps (e.g., scroll maps showing users never reaching key information or click maps clustering around inactive elements)
From here, decide whether a test is justified. If the data points to a clear opportunity, test it. If the signals conflict or remain unclear, gather more evidence first.
Choosing the right type of test for the problem you want to solve
There are various types of tests you can run on your website or app. However, the one you choose depends on the problem you’re trying to solve.
Here are some common types of tests and what they’re best suited for.
PS: Please note that we are labeling these experiments as tests. Not all of them are randomized controlled experiments (or A/B tests).
- A/A test
An A/A test splits traffic between two identical versions of the same page. Nothing changes visually; you’re simply checking that your tracking and traffic allocation behave as expected. If both versions are truly identical, the results should be nearly the same, but if results differ significantly, that’s usually a sign that something is off in your setup.
Best used for: Validating tracking accuracy of your platform, checking traffic distribution, and testing a new experimentation setup before launching live tests. - Simple A/B test
A simple A/B test compares one variation of a page against the original. You change one core element (e.g., form fields, headline, CTA) and measure the impact. Because the change is focused, the result is usually easier to interpret, especially when the hypothesis is clear from the start.
Best used for: Validating a single hypothesis, optimizing a high-impact page, and resolving internal debates about a proposed change. - A/B/n test
An A/B/n test expands on the basic A/B format by testing multiple variations at the same time. For instance, you might test three different value propositions on a homepage to see which angle resonates most. Traffic is divided across all variations, so you need enough volume to support the test.
Best used for: Testing multiple messaging angles, narrowing down design concepts, and early-stage optimization on high-traffic pages. - Multivariate test
A multivariate test examines several elements on the same page at once to see how different combinations perform. Instead of changing just a headline, you might test headlines, images, and CTAs to see which elements perform better together. However, you need substantial traffic since each combination requires enough exposure to be reliable.
Best used for: Optimizing high-traffic pages, understanding the effects of interaction between page elements, and fine-tuning page components. - Split page test
A split page test (or redirect test) sends visitors to two completely different URLs. Instead of modifying elements on the same page, you compare two distinct versions. This works well for structural changes like a redesigned checkout, a new pricing layout, or a different page architecture.
Best used for: Testing major redesigns, validating new flows, and comparing different page structures or navigation models. - Feature flag
A feature flag lets you release a new feature/functionality to a subset of users without fully deploying it to everyone. For example, you might release a new recommendation engine or onboarding step to 25% of users and monitor its effect on engagement or retention. If performance drops or issues arise, you can adjust or turn it off quickly.
Best used for: Introducing new product features, testing backend logic, and minimizing risk during product launches. - Painted door test
A painted door test measures interest in a feature or product before you build it fully. You present the option as if it already exists and track how users respond.
For instance, you could add a new button in the dashboard and show a “coming soon” message with a waitlist when users click it. DTC marketers use this test often to gauge demand for new products before investing in inventory or production.
Best used for: Validating feature demand, prioritizing roadmap decisions, and testing interest before development. - Bandit test
A bandit test automatically shifts more traffic to the variation that’s performing better as results roll in. Instead of keeping traffic evenly split, the allocation adapts over time based on performance. While this can help protect revenue in high-traffic tests, it often favors short-term gains over deeper learning about why certain variations underperform.
Best used for: Time-sensitive experiments, high-traffic campaigns, short-term revenue optimization.
💡Convert supports these test types in one place
Convert supports A/A tests, simple A/B tests, A/B/n tests, multivariate tests, redirect tests, and feature flag experiments through a single, unified interface. There are no separate modules or add-ons to manage.
Everything runs within one panel, which makes it easier to switch between test types, manage traffic allocation, and monitor results without jumping between tools.
How to conduct pre-test analysis
Before you launch a test, clarify what result would actually matter and whether you have enough traffic to detect it. This process, known as pre-test analysis, prevents you from running experiments that are statistically weak or strategically pointless.
Understanding Minimum Detectable Effect (MDE) and Minimum Practical Significance
| Minimum Detectable Effect (MDE) | Minimum Practical Significance |
||||||||||
|---|---|---|---|---|---|---|---|---|---|---|---|
| This is the smallest lift your test is powered to reliably detect, given your traffic and statistical settings. | This is the smallest lift that would be meaningful enough to justify implementation from a business perspective. |
Just because you can detect a small lift does not mean it is worth pursuing. A 0.2% absolute increase in conversions might be statistically significant, but if it barely increases revenue or doesn’t justify implementation effort, it may not be practically meaningful.
Most teams use an A/B testing calculator to estimate MDE. To do this, you typically need to input:
- Your baseline conversion rate
- Desired statistical power, often 80%
- Significance level (or risk you’re comfortable taking), often 5%
- Available sample size or planned test duration
The calculator then estimates the smallest lift your test can reliably detect based on those inputs.
Note: MDE and sample size move in opposite directions. Detecting smaller lifts requires more traffic, while larger lifts require less. If your traffic is limited, you should prioritize bigger, more meaningful changes. But if your traffic is high, you can test more nuanced improvements.
Choosing the right statistical framework
Most experimentation tools rely on one of two statistical frameworks: Frequentist or Bayesian. Both are valid, but they approach evidence differently and shape how you interpret outcomes.
Frequentist testing
Frequentist statistics come from the randomized controlled trial (RCT) world and were the first statistical methodology used in A/B testing. They rely on fixed sample sizes, pre-defined significance thresholds, and error control across repeated experiments.
When the test completes, you get a p-value and confidence interval that tell you whether the uplift you’ve detected is a true change or the result of noise.
Frequentist statistics is unintuitive. But even novice testers can rely on its robust framework – which does most of the de-risking – to guide them to reliable results.
Common pitfalls with Frequentist testing:
- P-hacking and peeking: Examining results early and stopping when significance is reached inflates false positives.
- Misinterpreting p-values: A p-value is not “the probability the null is true.” It’s about how consistent your data is with the null, not the null itself.
- Underpowered tests: Too little traffic leads to missed effects (type II errors)
- ‘Significance’ doesn’t mean ‘act’: A result that clears the 0.05 threshold doesn’t automatically justify rollout. Business context matters.
Bayesian testing
Bayesian statistics are a probabilistic framework for reasoning under uncertainty. Instead of relying only on fixed sample sizes and long-run error rates, it updates beliefs as new data comes in.
The math comes from Bayes’ Theorem, but in practice it’s a way of asking: Given what I already believe, and what I’ve now observed, how likely is it that this variation is better?
Despite its appeal, Bayesian analysis isn’t magic. Marketers and testers often trip up in a few areas:
- Priors are subjective. They need to be chosen and justified, not hidden. If vendors set them without transparency, you may be working with assumptions you didn’t agree to.
- Credible intervals ≠ confidence intervals. They’re interpreted differently, but many practitioners mix them up.
- Not a free pass on stopping rules. Some believe Bayesian testing means you can peek endlessly without consequence. In reality, stopping rules still matter.
- Complexity under the hood. Many Bayesian models require computationally heavy methods. Some testing platforms simplify this, but at the cost of hiding details from users.
Selecting the right metrics
The metric(s) you choose shapes how you design the experiment, how long you run it, and how you interpret the results.
In experimentation, it helps to think in terms of input, output, and outcomemetrics.
- Input metrics measure the health and activity of your experimentation program itself. They track how often you test, how consistently you learn, and how much lift your wins generate. Examples include experiment velocity, experiment win rate, and average lift per winning experiment.
- Output metrics are the direct performance indicators most stakeholders care about. These are tied to business performance and are often used in ROI calculations, e.g., website conversion rate, funnel conversion rate, revenue per visitor, and number of high-quality leads.
- Outcome metrics look beyond immediate conversion events and focus on longer-term impact. Examples include customer lifetime value, retention rate, churn rate, and net revenue over a defined period.
Choosing the right primary metric often means balancing output and outcome, e.g., you may optimize for conversion rate in the short term while monitoring retention as a downstream check. - Guardrail metrics are secondary metrics that protect against unintended consequences. They must either remain stable or improve while your primary metric moves. For example, if your primary metric is checkout conversion rate, guardrails might include refund rate, customer support tickets, and average order value.
Designing variants that maximize learning (not just wins)
Once you’ve defined your metrics, the next step is turning your hypothesis into something testable.
One way to pressure-test your variant (or execution) is the ALARM protocol. Developed by GAIN Conversion, ALARM is a structured framework designed to improve experiment quality by challenging assumptions, identifying risks, and strengthening execution.
ALARM stands for:
A — Alternative Executions
Instead of choosing the first idea that comes to mind, this step encourages exploring different ways to test the same hypothesis to ensure that the best possible approach is used.
L — Loss Factors
This involves identifying potential risks or reasons why the experiment might fail, such low visibility, competing elements, or unclear messaging. Identifying loss factors help you remove friction before launching.
A — Audience and Area
This step defines who will see the experiment (audience) and where it will be implemented on the website (area). Not every change needs to be site-wide, so defining the audience segment and page context prevents diluting impact or misreading results.
R — Rigor
This involves applying data-driven insights and psychological principles to strengthen the experiment and ensure it is scientifically sound. That might mean incorporating social proof, reducing cognitive load, or clarifying value propositions based on prior research.
M — MDE & MVE (Minimum Detectable Effect & Minimum Viable Experiment)
This focuses on determining the smallest improvement worth detecting (MDE) and designing the simplest, most efficient version of the experiment (MVE) to run. This prevents you from overbuilding before you know for sure that the concept works.
Applied properly, ALARM reduces the risk of invalidating a strong hypothesis through weak execution.
How to run tests without corrupting your data
As you prepare to launch your experiment, remember that clean execution determines whether your results are trustworthy. Here’s how to run tests without corrupting your data.
- QA properly before deployment
Before going live, conduct quality assurance to ensure every layer of your experiment works as intended. Load it on desktop and mobile, trigger the primary goal and confirm that the event fires correctly in your analytics tool. Also, review traffic allocation and targeting rules to make sure the right users see the right version. - Ensure zero flickering
Flicker happens when users briefly see the control before the variant loads. That split-second flash can affect behavior and skew results, especially on high-intent pages.
To prevent flicker, choose tools that disclose their true stub size and don’t hide runtime configurations. For example, Convert transparently includes 3–5 embedded experiences in its size and doesn’t require an additional anti-flicker snippet to reduce layout shifts and inconsistent rendering. - Prevent sample size pollution
Sample size pollution happens when outside factors distort your data, such as mixing device types, traffic sources, or browsers that vary widely in performance. This increases variance and makes results harder to interpret.
You can reduce pollution by running separate tests for mobile and desktop, running different tests for different browsers, and keeping targeting rules consistent across environments. - Don’t peek
Stopping a test early because results look promising increases the risk of false positives. Early swings are common and they often reverse, so keep the test running.
If you absolutely need ongoing monitoring, use sequential testing. Sequential methods adjust statistical thresholds as data accumulates, so you can monitor performance without compromising validity.
How to analyze results beyond winners and losers
If all you record after an experiment is which variant beat the control, you’re leaving most of the value on the table. The real return from experimentation comes from understanding why something worked, where it worked, and what that implies for future decisions.
Here’s how to analyze results with that mindset.
- Look at effect size, not just significance
Statistical significance tells you whether a difference is unlikely to be random, but it doesn’t tell you whether the difference is meaningful.
A variant can reach significance with a lift so small it barely moves revenue. On the other hand, a test might fall short of strict thresholds but show a sizable directional impact worth retesting with more traffic.
Always examine the magnitude of change alongside confidence. Ask yourself: If this lift holds, does it materially change the business? - Check segment-level behavior
Topline results can hide useful patterns, so segment the data by device, user type, traffic source, or geography.
Sometimes a variant underperforms overall but performs strongly for a specific cohort, such as returning users or paid traffic. But ensure that you don’t default to cherry-picking metrics to force a winner from the results. Balance is key here.
A rule of thumb: If the test is inconclusive (or has lost) for the primary metric picked before deployment, the test should be marked as such. Post-test segmentation and review of additional metrics is a learning exercise to influence future iterations.
- Validate guardrails
Your primary metric moving in the right direction is only half the story. Next, review guardrail metrics that protect long-term value, such as retention, refund rate, average order value, or support tickets.
A variant that increases conversions but lowers customer quality is not a sustainable win. Guardrails make you evaluate impact across the system rather than just one part of the funnel. - Revisit the hypothesis
Return to the original reasoning behind the test. Did the outcome confirm the underlying assumption, or challenge it?
If the test lost, was the idea flawed, or was it poorly implemented? If it won, what psychological or structural mechanism likely drove the improvement? These questions allow you to learn from your experiment. - Extract a transferable insight
The final step is translating the result into something reusable.
Did users respond better to clarity than depth? Did reducing cognitive load outperform adding more persuasive elements? Write down the principle in plain language, and let it inform future variants across pages, campaigns, or even products.
Pro tip: You could keep an A/B testing repository where you record these insights so teams can access them.
Mapping your go/no-go decisions for your results
Every test should end with a predefined action. If you wait until results come in to decide what to do, bias creeps in. Pre-committing to next steps keeps decisions disciplined and prevents you from rationalizing borderline outcomes.
Before you launch, define what counts as a win, loss, or inconclusive. Then map each outcome to a clear action.
| Result type | What it means | Action |
|||||||||||||||
|---|---|---|---|---|---|---|---|---|---|---|---|---|---|---|---|---|---|
| Winner | Lift exceeds your practical threshold and passes statistical criteria | Ship the variant, monitor guardrails, document the insight | |||||||||||||||
| Loser | Performance declines meaningfully or confidence strongly favors control | Do not ship; revisit hypothesis and execution | |||||||||||||||
| Inconclusive (Flat) | No meaningful difference within your MDE window | Decide whether to retest with more power, refine the idea, or move on |
How GenAI is actually helping experimentation today
In Marcella’s survey, 83.3% of experimenters said they use generative AI tools like ChatGPT and Claude daily. The most common use case by far is analyzing large data sets, followed by ideation, low-fidelity prototyping, coding support, and even treating AI as a thought partner.
Across the board, respondents emphasized the importance of keeping a human in the loop. Used well, AI can accelerate workflows and expand what’s possible, but it’s not replacing human judgment anytime soon.
This is because AI models hallucinate.
An AI hallucination is when the model produces information that sounds confident and coherent but is inaccurate, fabricated, or unsupported by data. In experimentation, that can mean inventing insights from thin data, misinterpreting results, or overstating causality.
Hallucinations happen because large language models predict likely patterns in text. They don’t “know” facts, so when context is missing, ambiguous, or poorly structured, the model fills in the gaps.
While you can’t completely eliminate hallucinations, you can reduce them by:
- Using a validation-based interaction pattern: Ask the model to restate inputs, cite assumptions, and verify conclusions against real data before you act on them.
- Optimizing your prompts: Be explicit about data sources, constraints, and what the model should ignore. Clear structure reduces drift and speculative answers.
- Using self-consistency checks: Generate multiple answers to the same question and compare them. If responses converge, confidence increases. If they vary widely, the reasoning likely needs review.
You can also use AI to support experimentation more structurally:
- Use small, specialized models as copilots: Smaller, domain-specific models can run locally and focus on narrow tasks like variant generation or pattern detection. They’re often more controllable and predictable than large general-purpose models.
- Build agents with Convert MCP: Convert MCP access allows you to build AI agents or workflows that interact directly with live experimentation data. These agents can summarize experiments, generate reports, or automate routine actions within your testing workflow.
Incorporating AI into your experimentation program is less about whether you can build and launch something and more about whether you can trust the result and learn from it properly.
💡AI should not replace human judgement
While AI can draft variants, suggest ideas, summarize learning, surface anomalies, and reduce reporting or admin work, it shouldn’t replace human experimenters in the testing process. Because AI hallucinates, human judgement is needed when it comes to declaring winners, interpreting messy results, and approving what goes live (and what gets scrapped).
👉 If you’d like some guidance on using AI for experimentation, check out our AI Playbook that shows you how to use AI for research, discovery, problem statements, hypotheses, and more.
Mistakes to avoid when running A/B tests
If you want your results to hold up under scrutiny, here are some mistakes to avoid:
- Setting MDE without grounding it in real data
Your MDE should reflect actual baseline performance and realistic traffic levels. If you pick a number arbitrarily, you risk designing a test that can never reach power or that tracks changes that are too small to matter. - Running Bayesian tests with uninformed priors
Bayesian testing allows you to use prior information. However, priors should be grounded in historical performance or comparable past tests, not in what you hope will happen.
If you have reliable baseline data, use it to inform the prior. If you don’t, keep the prior neutral rather than skewing it toward a preferred outcome. This prevents you from diluting the model’s strength or biasing the results. - Skipping Minimum Practical Significance
Statistical significance is not the same as business impact.
If you never define what lift actually justifies implementation, you’ll celebrate gains that don’t necessarily improve revenue. Every test should have a practical threshold tied to cost, effort, and upside. - Confusing random swings with real performance
Regression to the mean is common in experimentation. A page that performs unusually well or poorly will often drift back toward its baseline over time.
If you test immediately after a spike or drop, you may misinterpret natural fluctuation as a real effect. Having an adequate sample size and disciplined timing reduce this risk. - Ignoring data mismatch across tools
Different platforms measure conversions differently. As such, your analytics tool, experimentation platform, and CRM may not align perfectly.
If you don’t anticipate these discrepancies, you’ll spend more time arguing about numbers than interpreting results. Before launching a test, confirm which source of truth governs decision-making and understand how each system tracks events. - Staying too long in the same optimization zone
It’s easy to keep tweaking the same page, layout, or flow because it’s familiar and already performing well. Over time, those small improvements start producing smaller and smaller gains.
To move beyond that plateau, mix refinement tests with more ambitious experiments. Test new value propositions, alternative page structures, or entirely different user journeys. A healthy experimentation program improves what exists while also exploring what might work better.
Avoiding these mistakes doesn’t guarantee wins, but it ensures that when you do win, the result is worth shipping.
What’s coming next: The future of experimentation in 2027
The DNA of experimentation is changing.
- Generative AI technologies are reshaping how customers buy and the role of traditional websites. At worst, prospects convert in chat interfaces. At best, they visit websites to build credibility after firming up their shortlists.
- But at the same time, since shipping assets is no longer the bottleneck, and already-fragmented attention spans are crumbling due to a tsunami of “AI slop”, producing what moves the needle by learning from tests is non-negotiable.
These trends collide as the rise of full-stack testing. Server-side for not only better tracking, reporting, and compliance, but also for robust experimentation involving the very architecture of a business, as opposed to UI tweaks. - Our research shows that testers want AI-assistance to speed up review mining, analysis, triangulation, test builds, QA, and post-test learning. Yet, they are wary of compliance misdemeanours and code debt resulting from the black box nature of AI. The agentic future isn’t quite here yet.
- Finally, experimentation is losing its specialist status. As legacy A/B testing tools get rolled into existing platforms, CRO agencies merge with marketing firms, the individual CRO or tester must also complement & upskill to operate in growth or product teams.


Written By
Althea Storm
Edited By
Carmen Apostu

Fact-Checked By
Ahmed, Carmen Apostu, Karim Naufal, Marcella Sullivan


Contributions By
Ellie Hughes, Nils Koppelmann

