Sample Ratio Mismatch (SRM): Why It Invalidates A/B Tests and How to Fix It
Some A/B tests are doomed before the first conversion rolls in.
If your traffic split is off, even slightly, your results might look clean while quietly misleading you. That’s Sample Ratio Mismatch: when test variants don’t get the exposure they’re supposed to, and the assumptions behind your stats fall apart.
SRM breaks randomization. It skews metrics. And if you miss it, you could ship the wrong winner.
In this guide, you’ll learn how SRM happens, how to detect it, and what to do when it shows up so you’re not optimizing on bad data.
What Is Sample Ratio Mismatch (SRM)?
Sample Ratio Mismatch (or Sample Size Ratio Mismatch) happens when the actual user distribution in your A/B test doesn’t match the ratio you configured.
If you set a 50/50 split and see 60% of users in one variant and 40% in the other, it’s a sign that something is broken. SRM means the random assignment failed, and your results may be biased from the start.
Most teams measure SRM using a chi-squared test, which compares the observed sample sizes against what was expected. If the p-value is below 0.01 (p < 0.01), there’s strong statistical evidence that the mismatch didn’t happen by chance.
A few key points before we dig deeper into this:
- SRM is about users, not sessions. Users are the unit of randomization. Session-based SRM can occur, but a user-level mismatch is more severe.
- Small differences are fine. A variation getting 4987 users instead of 5000 is normal. A gap of thousands—or a significant chi-squared result—isn’t.
- SRM is a red flag, not noise. It often points to deeper issues, such as broken tracking, misconfigured scripts, data pipeline bugs, or flawed randomization logic.
SRM also has a rather insidious impact on your MDE. Since SRM means the randomization logic has broken down, it also implies that confounding variables have been introduced. Plus, the variant receiving the smaller sample size now contributes disproportionately more variance to the result. Both developments compromise any minimum detectable effect (MDE) you may have chosen.
Watch this video with Lukas Vermeer as he dives into the specifics of SRM and more FAQs on the topic.
Why Sample Ratio Mismatch Undermines Your Test Results
When SRM shows up, your test isn’t just “a little off”. It’s structurally compromised, see example below.

Random assignment is the backbone of A/B testing. It ensures that any differences you observe between test groups can reasonably be attributed to your change.
SRM breaks that link.
Here’s why that matters:
- It introduces hidden bias: SRM suggests that your groups aren’t comparable. That could mean one variant is missing a key user segment, or one is overloaded with high-converting traffic. Either way, the groups no longer reflect the same population.
- It skews performance metrics: Even a small mismatch can distort conversion rates. You might falsely detect uplift or mask real changes, making your test outcomes misleading.
- It masks implementation issues: SRM is often a symptom, not the root problem. It might stem from faulty targeting, inconsistent bucketing, broken scripts, or filtering errors in your data pipeline. Until that’s fixed, nothing downstream can be trusted.
- It invalidates your statistical inference: Whether you’re using Frequentist or Bayesian methods, randomization is non-negotiable. If SRM is present, your test results are no longer grounded in valid assumptions.
The bottom line: If you don’t catch SRM in time, you risk acting on results that were never valid in the first place. You also deviate from your calculation of how long to run an A/B test, if SRM causes you to restart. This becomes a business challenge.
Causes of SRM in Experimentation
Sample Ratio Mismatch is the result of something deeper—an implementation bug, a logging failure, or a misstep in test setup—that silently breaks the assumptions your stats depend on.
The taxonomy below, adapted from Lukas Vermeer, is a useful framework for investigating SRM:

| Category | What to Check | ||||||||||
|---|---|---|---|---|---|---|---|---|---|---|---|
| Experiment Assignment | Randomization logic, user bucketing, dogfooding | ||||||||||
| Experiment Execution | Script placement, variation launch timing, incorrect targeting | ||||||||||
| Experiment Log Processing | Bot traffic, user-agent mismatches, log delays or dropouts | ||||||||||
| Experiment Analysis | Faulty triggers, manual exposure, broken event tracking | ||||||||||
| Experiment Interference | Paused variations, overlapping experiments, site changes during test |
Let’s walk through what each one looks like in the wild and what you should check if your experiment fails the SRM test.
Experiment Assignment: When Bucketing Breaks Down
Random assignment is the foundation of valid A/B testing, and it’s surprisingly easy to get wrong.
Case in point: data scientists at Wish discovered SRM issues on an A/A test and, after a long investigation, concluded that the SRM arose because their randomization was not completely random.

Other common causes:
- User ID collisions
- Device-specific assignment logic
- Internal testers or employees (dogfooding) slipping into test traffic
To avoid this, check:
- Is your bucketing function deterministic and stable?
- Are internal users excluded from experiments?
- Are user IDs consistently generated and applied?
Convert has its own randomization algorithm that’s designed to prevent uneven splits between variations, so SRM is unlikely to be caused by our built-in bucketing.
However, if you have implemented randomization with another tool, you can follow these steps to bucket visitors into variations.
Experiment Execution: Script, Targeting, Timing
Even if your user assignment is rock-solid, SRM can still creep in during execution, especially when test scripts aren’t deployed evenly or targeting rules quietly misfire.
In one case, a Convert customer ran into SRM because the experiment script was missing on one of the variation pages. The variation never rendered for a large segment of users, creating a traffic imbalance that looked random until closer inspection.
Another example involved page targeting misfires in a Split URL test. The redirection logic didn’t match every variation URL correctly, so some users who were supposed to see the test were dropped before they ever reached it.
These issues don’t always throw errors. They just quietly break the experiment.
What to check:
- Are test scripts installed on all relevant pages and variations?
- Are targeting rules and URL match conditions consistent across variants?
- Did all variants launch simultaneously and stay live throughout?
Experiment Logging: Bots, Blockers, and Browser Gaps
Sometimes, SRM comes down to what gets logged and what doesn’t.
In another case, Convert’s team noticed SRM in a test where “Browser = Other” showed a heavy imbalance. When they filtered traffic to only Chrome and Safari, the SRM vanished. The culprit was a bot with the user-agent “site24x7,” which wasn’t filtered out of analytics.
Other scenarios could be:
- Traffic from outdated or headless browsers
- Logging tools dropping users due to ad blockers
- Logs arriving late or being partially written
What to check:
- Is your analytics setup filtering known bots and test tools?
- Are user agents mapped consistently across platforms?
- Are your logs complete across all user groups?
Experiment Analysis: Triggering Gone Wrong
Some platforms, including Convert on Single Page Applications (SPAs), allow manual control of when a test variation triggers. This flexibility is powerful—but risky.
If your test relies on code like:
window._conv_q = _conv_q || [];
window._conv_q.push(["run","true"]);
… it’s on you to ensure it fires at the right time for every eligible user.
What to check:
- Are manual triggers implemented consistently?
- Are exposure events being sent to your analytics platform?
- Is the test marking exposure before users interact?
Experiment Interference: Collisions and Manual Overrides
This refers to a user intervention where one of the variations is paused during the experience.
Imagine you have a Split URL test that has been running for several weeks, and either by mistake or on purpose, you pause the Variation while leaving the Original running.
Immediately after, and depending on your website traffic, you will notice SRM calculated for your test.
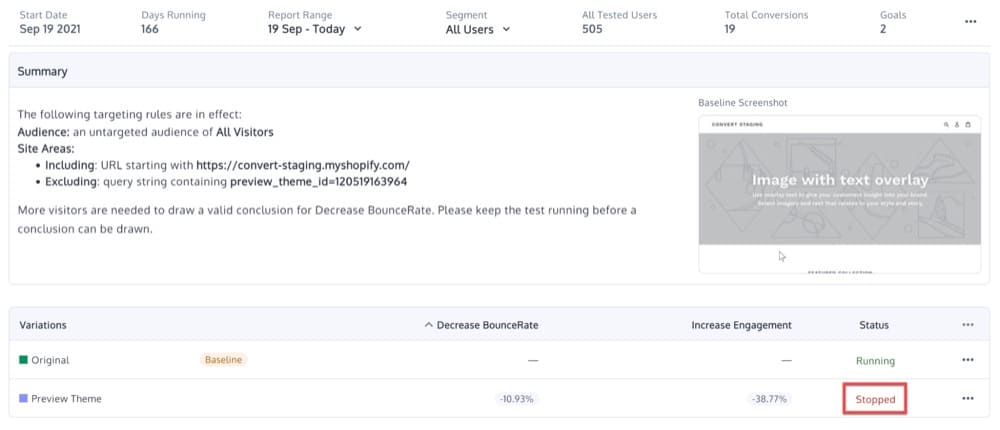
In this case, you can either exclude the date range when the variation was paused or reset the experience data.
What to check:
- Have any variations been paused, relaunched, or changed mid-test?
- Are concurrent experiments using overlapping audiences or URLs?
- Have any deployments altered site behavior during the test window?
Non Experiment Reasons
If none of the above categories reveal the root cause of your SRM, we suggest you add an error tracking software on your website (like Sentry) to identify deeper problems with your site.
How to Detect SRM During a Test
The most reliable way to detect SRM is with a chi-squared goodness-of-fit test. But you shouldn’t wait for statistical confirmation to start watching for signs. SRM is often visible before the numbers even finish rolling in.
Here’s how to catch it early and confirm it accurately.
1. Use a Sample Ratio Mismatch Calculator
SRM happens when the observed number of users in each variant deviates from the expected allocation. A chi-squared test compares those numbers and returns a p-value (a measure of how likely that imbalance is to occur by chance).
- Use p < 0.01 as your single SRM threshold. Any value below this cut-off reveals a broken split.
- SRM tests should always be run on users, not sessions or visits.
Let’s illustrate with an example:
You set up a 50/50 A/B test. After a few days, you see:
- Variant A: 48,500 users
- Variant B: 51,500 users
That’s a difference of 3,000 users. Intuitively, it looks off. An SRM calculator confirms it: the p-value is 0.0002. That’s a broken test.
Use one of these tools to check:
- Convert’s A/B test calculator (includes SRM detection): Helps with diagnosing sample ratio mismatch, and it also tells you how much time you need to wait for your experiment to complete!

- Lukas Vermeer’s SRM calculator

2. Set Continuous Monitoring and Alerts
Don’t treat SRM as a one-time check. If you only look at sample ratios at the end of a test, you risk wasting days, even weeks, on corrupted data.
Many testing platforms support built-in SRM alerts.
In Convert Experiences, you can enable automatic SRM checks under Configuration > More Settings. If SRM is detected during a test, it’s flagged directly in the report view.

If your platform doesn’t support this natively, consider building a lightweight alert using daily exports and a script that checks sample ratios and flags low p-values.
3. Look for Obvious Mismatches Early
Some SRMs are subtle. Others are glaring.
If you see 1,000 users in one group and 100 in another, or a 33/33/33 split that shows up as 20/50/30, you probably don’t need a calculator to tell you something’s wrong.
Build a habit of reviewing cumulative group sizes in the first few hours and the first few days of a test.
Dig Deeper With Segment-level Checks
Sometimes the overall SRM appears fine, but one user group is way off. Check breakdowns by:
- Browser
- Device type
- Geographic location
- Source or campaign

If you find SRM in a segment (e.g., “Browser = Other”), it might point to bot traffic, script load issues, or misconfigured redirections.
You can also compare triggered group SRM vs. total eligible group SRM. This helps diagnose issues with manual triggers or exposure logic.
4. Run Your First SRM Check Within 48 Hours
Most teams only check for SRM after a result looks suspicious. That is the wrong order.
SRM is a randomization failure. Checking it late means you may have already spent days or weeks collecting data from a broken test. The earlier you catch it, the less wasted runtime you absorb.
The right habit: run your first SRM check within 48 hours of launch, before any conversion data is meaningful enough to act on. This gives you time to catch configuration errors (e.g., SDK firing issues, redirect loops, bot traffic spikes) before they contaminate the full dataset.
Use Convert’s A/B test calculator to check your split at the 48-hour mark. If the p-value falls below 0.01, pause the test and investigate before reading any conversion numbers.
Tip: Set a calendar reminder for day 2 of every test. SRM caught early saves you a week of bad data.
Real-World SRM Scenarios (and What to Do About Them)
Not all SRMs are created equal. Some are dead ends. Others are repairable. A few are false alarms.
Below are common SRM scenarios you’ll likely encounter in the wild, plus how to handle each one without guesswork.
Scenario 1: The Numbers Are Way Off
You run a 50/50 A/B test expecting a clean split. But when you check the data:
- Control: 21,588 users
- Treatment: 15,482 users

The SRM calculator returns a p-value of < 0.0001 (well under 0.01).
That difference is statistically impossible under normal random assignment. You’re not just seeing noise. This is a broken test.
Likely causes:
- Script failed to load for one variant
- A variation didn’t launch or was paused
- Redirection logic excluded a group of users
What to do: Stop the test. Investigate the root cause. Once fixed, restart with a clean assignment and fresh traffic.
Scenario 2: SRM Is Isolated to One Segment
You run an A/B test. The overall group looks fine, but when you segment by browser:
- Chrome/Safari: Balanced
- “Browser = Other”: Heavily skewed
Turns out the outlier traffic comes from a bot misclassified under “Other”. (We mentioned this actually happened to one of our users earlier.)
This means that SRM is being driven by a non-human or filtered user group. Once that segment is excluded, the traffic split returns to normal.
What to do: Filter out the bad segment. Re-analyze with clean data. If exposure outside the segment was unaffected, the test may still be valid.
Scenario 3: SRM Flagged, But Conversion Trends Are Stable
Your testing tool flags SRM. But looking at the test graph:
- Conversion rate curves stay parallel
- Confidence interval is tight (e.g., 99.99%)
- No major traffic imbalance across segments
The SRM flag may be a false positive, but don’t risk it.
Even “stable” trends come from a split you can’t trust. It’s like judging a race where one runner got a head start: the finish times mean nothing unless you reset the starting line.
What to do: Treat any SRM as a broken experiment. Pause analysis, dig into the cause, then fix the split before you draw a single conclusion.
Scenario 4: Bot Traffic Inflates One Variant’s Sample
A SaaS team runs a 50/50 checkout flow test for 14 days. Final user counts:
Control: 24,100 users. Variant: 19,900 users. (Expected: 22,000 each.)
The SRM calculator returns p less than 0.0001. Working through segment breakdowns, the team finds the imbalance is concentrated in “Browser = Other.” Filtering that segment and rerunning confirms it is bot traffic routed disproportionately to the control.
The test had appeared to show the variant outperforming by 6.2%. After filtering the bot traffic and reanalyzing, measured lift dropped to 1.1% — below the minimum detectable effect threshold. The result was inconclusive, not a win.
Shipping the variant based on the original read would have deployed a non-winner and consumed roughly two weeks of engineering time on a change with no real effect. The cost of the SRM was not the bad data it was the downstream decision it would have driven.
What to Do When You Detect SRM
Once you’ve confirmed SRM, decide whether to fix it or scrap the test.
Here’s a decision flow to guide you:
Step 1: Check the size and source of the imbalance
Is the sample split mildly off (e.g., 49.8% / 50.2%) or clearly broken (e.g., 60/40)? Or is the SRM flagged across all users, or isolated to a specific segment (browser, device, geography)?
Minor deviations are often statistical noise. But major differences, especially with p-values < 0.01, are strong indicators of deeper issues.
Step 2: Segment the data to localize the problem
Use filters to see where the imbalance is coming from:
- Try browser, device, and location breakdowns
- Check against bot filters, internal traffic, or unusual referrers
- Compare triggered vs untriggered users (if applicable)
If SRM disappears when a single segment is excluded, you may have found a non-random traffic source or logging error you can isolate.
Step 3: Check exposure and triggering logic
Especially on SPAs or tools with manual exposure:
- Confirm that exposure triggers fire consistently
- Check if one variant had a broken or delayed script
- Look for major page load timing differences
This is where silent failures often hide.
Step 4: Evaluate Whether the Test Is Salvageable
Use this rough rubric:
| Condition | Recommended Action | ||||||||||
|---|---|---|---|---|---|---|---|---|---|---|---|
| SRM is global, large, and unexplainable | Stop the test and restart | ||||||||||
| SRM is isolated and fixable (e.g., bots, browsers) | Reanalyze filtered data | ||||||||||
| SRM is flagged but behavior is consistent | Monitor, but proceed |
If you need to restart, make sure to reset buckets so users are newly assigned. Carrying over the same assignments risks inherited bias.
Step 5: Fix the root cause before running again
Once the cause is identified:
- Patch broken scripts or targeting rules
- Add filters for bots or malformed user agents
- Tighten up triggering or exposure tracking
- Update QA checklists to prevent repeat issues
The worst outcome isn’t detecting SRM. It’s detecting it, fixing nothing, and repeating the same mistake on the next test.
SRM Affects Both Frequentist and Bayesian Stats Engines
SRM is a randomization problem.
If your traffic split is broken, it doesn’t matter how sophisticated your stats engine is. Bayesian, Frequentist, sequential, you’re still analyzing biased data.
Random assignment is what makes statistical inference possible. When that assumption fails, your uplift, confidence intervals, or posterior probabilities all become suspect. The outputs might look mathematically sound, but they’re modeling the wrong inputs.
This means:
- SRM can silently invalidate Bayesian A/B test results, just like it does for Frequentist ones.
- SRM detection should be part of your QA process, regardless of which statistical method your platform uses.
- The same chi-squared test works across engines; it’s a check on your sample distribution, not your inference method.
So if your team runs Bayesian experiments and skips SRM checks, don’t.
Which A/B Testing Platforms Offer Built-In SRM Checks?
Convert Experiences has built-in SRM checks. If you’re a user, you can enable SRM checks from Configuration > More Settings. Then you’ll be able to see the SRM tags in the reports:

“SRM Detected” appears directly in the experiment overview, so your team can investigate immediately.
Here are more A/B testing platforms that support SRM functionality and give you alerts:
| Platform | SRM Alerts | How It Works |
|||||||||||||||
|---|---|---|---|---|---|---|---|---|---|---|---|---|---|---|---|---|---|
| Convert | ✅ Yes | SRM tags appear in reports; the chi-squared test auto-run on users | |||||||||||||||
| Optimizely | ✅ Yes | Uses ssrm-test service across all experiments | |||||||||||||||
| GrowthBook | ✅ Yes | Flags SRM when p-value | |||||||||||||||
| Split.io | ✅ Yes | Checks sample ratio in real-time under each experiment summary | |||||||||||||||
| Statsig | ✅ Yes | Uses a Chi-squared test and monitors the SRM p-value over time | |||||||||||||||
| VWO | ✅ Yes | Runs statistical checks in the background, including SRM detection | |||||||||||||||
| AB Tasty | ⚠️ Partial | Only for users in the Early Adopters program. Others have to use AB Tasty’s SRM calculator. | |||||||||||||||
| Adobe Target via MiaProva integration | ⚠️ Partial | MiaProva applies chi-squared test to all A/B activities |
Important: Please, don’t assume your platform is watching for SRM. If it’s not on by default, you’re the safety net.
Sample Ratio Mismatch Demystified
You might ask, how often is it “normal” to see an SRM?
Lukas Vermeer said it best: “Even big tech firms observe a natural frequency of SRMs of 6% to 10% in their online controlled experiments.” This figure isn’t a statistical artifact or false-positive rate tied to your p-value; rather, it reflects how often genuine implementation bugs or tracking issues crop up in complex experimentation setups and must be caught.
Now, if the SRM repeats more frequently, that warrants a deeper investigation into the experiment design or the website.
Our team is always available to assist you if you are experiencing problems like those above! Click here to reach out to our team.


Written By
Dionysia Kontotasiou, Uwemedimo Usa


Edited By
Carmen Apostu
