GA4 and Convert Experiences: Tips for a Smooth Transition
GA4 brought a slew of changes that impact how optimizers analyze test results. Our support chat has seen an influx of questions about GA4 recently as people try to figure out what this new version of GA means for them.
By now, you have probably heard that Google will deprecate the existing version of Google Analytics (Universal Analytics (UA)) in July 2023 in favor of GA4. This means Google will stop supporting and tracking UA, which has served as the default reporting tool for millions of websites since 2012. Google says that historical data from Universal Analytics will still be available for “at least six months” beyond the retirement date in July 2023.
Note: UA 360 properties will receive an additional year ending July 1, 2024.
Even though July 2023 may seem like plenty of time, you should already start preparing to move your A/B testing data from UA to GA4. And take advantage of our official GA4 integration, with GA4 conversion events (goals) import and automated revenue tracking.
This article explains what is changing, why you will be affected, how to move your A/B data to GA4, and eventually how to use it.
We’ve been here before. It’s not the first time we’ve moved from one GA version to another.
GA Classic Analytics (ga.js) and Universal Analytics (analytics.js) were easy to switch between. All that was needed was to update the tracking code on your website.
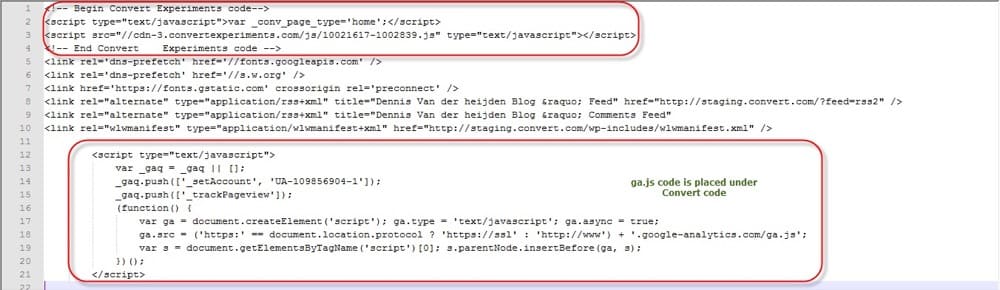
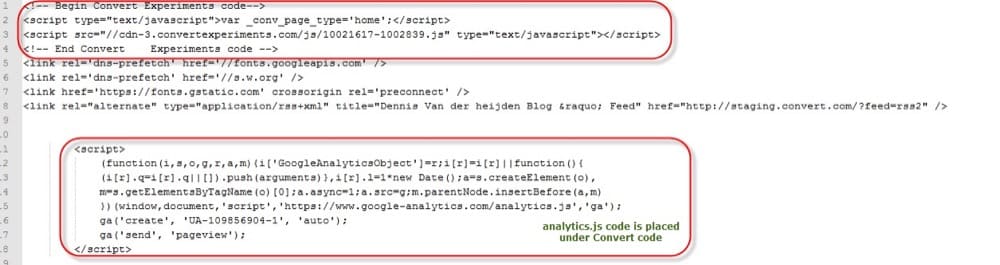
Your data was the same. The user experience, stats, etc. were all essentially the same. Even the integration with your A/B testing platform was a breeze. It only took a few clicks to start sending your A/B testing data to UA.
The situation is different this time around.
GA4: What Makes It Different?
If you’ve played around with GA4, you’ve probably seen how drastically different things are.
For starters, you won’t find any of the reports you’re used to. Since GA4 is highly customizable, you can customize what appears on your primary dashboard.
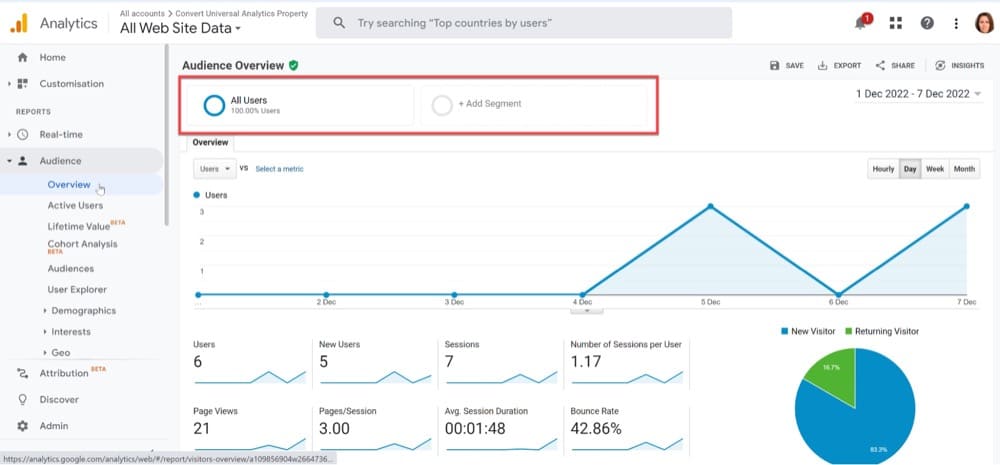
Here is a screenshot of the GA4 dashboard after logging in. (Note: You can access the Google demo account here.)
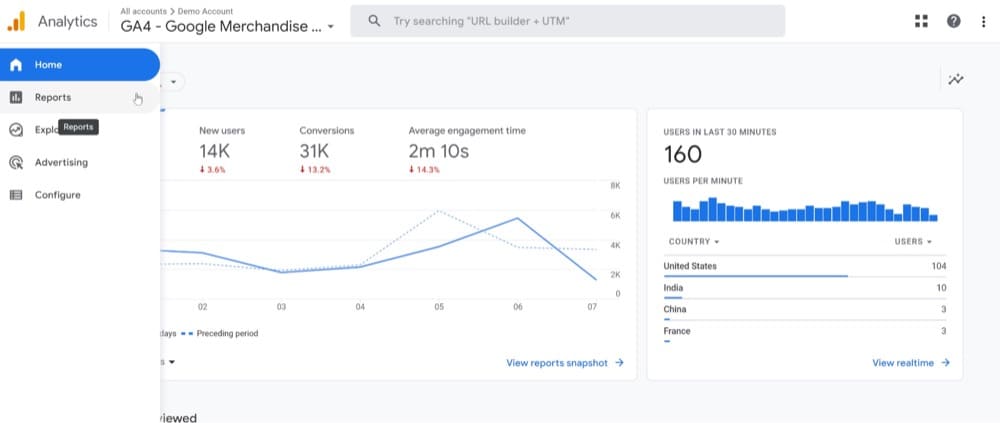
Audience and Acquisition have been replaced with Home, Reports, Explore, Advertising, or Configure on the left sidebar. (Plus a few more options if you have account editor access).
There are five key distinctions between GA4 and UA:
| Universal Analytics (UA) | Google Analytics 4 (GA4) |
||||||||||||||||
|---|---|---|---|---|---|---|---|---|---|---|---|---|---|---|---|---|---|
| Measurement | Session-based | Flexible event-based | |||||||||||||||
| Reporting | Limited across platforms and devices | Fully enabled across platforms and devices | |||||||||||||||
| Debugging | No DebugView report available | DebugView report available | |||||||||||||||
| Privacy / IP anonymization | Can be enabled/disabled | Enabled by default – can’t disable it due to privacy laws | |||||||||||||||
| Automation | Limited | Machine learning-based |
- Instead of sessions or page views, GA4 tracks events. As a result, you can determine which “events” are most important to your business.
- With the comprehensive cross-device and cross-platform reporting capabilities offered by GA4, you can monitor how each user interacts with your app or website. This provides a better understanding of the marketing impact.
- A new feature, DebugView, allows for a more detailed examination of incoming data (without the need to wait for hours). Real-time reports were available in UA, but these were not the best for troubleshooting and debugging tracking issues.
- UA routinely collected IP addresses from users. Since an IP address is regarded as personally identifiable information (PII), which is protected by the law, this was a violation of the GDPR. In order to enhance user privacy, Google Analytics enabled the IP anonymization option, which anonymized the last 3–4 digits of the users’ IP addresses. However, IP anonymization was not simple to use, required manual activation by users, and required editing of the tagging code. In GA4, IP anonymization is turned on by default and cannot be disabled. This means that GA4 won’t keep track of the users’ IP addresses or be able to track them.
- Rather than only reporting on past events, GA4 uses automation and AI to deliver predictive insights. Businesses can use this data for forecasting, targeting new audiences, and more.
What Are the Options for A/B Testers?
If you use UA in conjunction with A/B testing data, you will need to make arrangements for how and where to keep track of the A/B performance of your website. You will also have to take action to preserve your data because it won’t be compatible and won’t be available to you (if you don’t save it) beyond July 2023.
There are three alternatives to choose from, each explained below (4 if your team chooses a hybrid strategy combining options 2 and 3).
1. Adopt GA4
This is the case for most people. Making the decision to migrate to GA4 and taking the necessary precautions to maintain data integrity and seamless measurement.
As a GA4 user, you will be charged with identifying measurement gaps and updating KPIs to fill them. In addition to training your team on the new GA4 interface, you should also start gathering data (now) for yearly reporting needs.
Any CRO teams using UA will probably need more time and training to get used to the new structure because the interface in GA4 is very different from the previous one.
2. Switch to a Different Analytics Platform
More and more companies are switching to alternative analytics tools. Our recommendations below include two open source analytics alternatives that can also be integrated with your A/B testing platform.
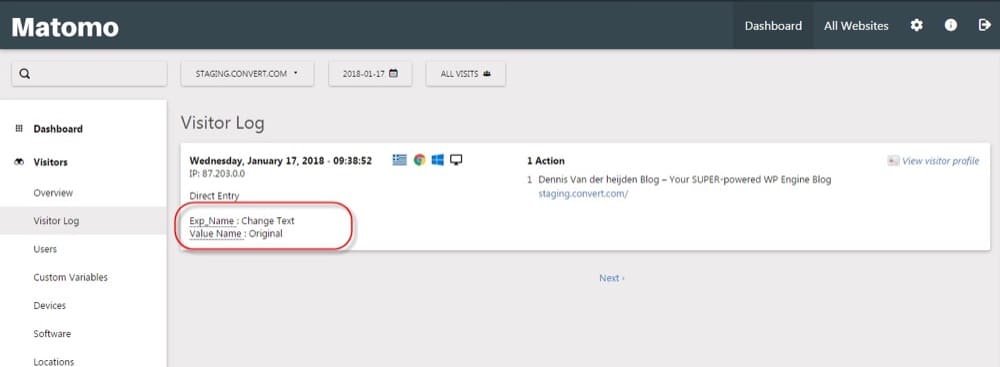
- Matomo
Similar to Google Analytics, Matomo is a web analytics application with a broad range of functions.
- Plausible
A compact and simple interface that offers the essential metrics and reports makes Plausible a good fit for most users.
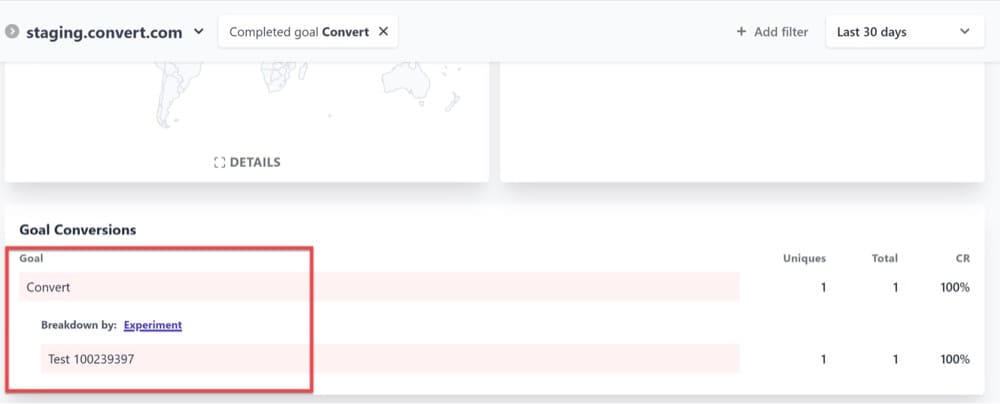
3. Implement an On-premise Analytics Solution
On-premise analytics solutions may offer greater utility, privacy, and compliance depending on how they are used. Platforms like Matomo and Countly allow for on-premise implementation, which means that your company keeps ALL visitor data rather than send it to Google Analytics (or any other third-party tool).
If you combine an on-premise analytics package with tools like Looker, PowerBI, or other owned digital platforms, you can instantly access data across numerous teams and assets.
Note: Please be advised that this solution requires substantial dev/engineering cooperation.
How to Integrate GA4 with Your A/B Testing Platform
If you’ve chosen to go with adopting GA4, in this section, we will explain how to use it together with your A/B data.
In order to really delve into how A/B testing efforts are affecting the experience of users, testers must be able to take a broad view of how users are interacting with a site, app, or marketing materials.
And that’s exactly what GA4 allows you to do.
By using the user segmentation feature in GA4, you can compare and evaluate how people use your site generally instead of just analyzing the specific goals you focused on during your A/B test.
The ability to delve beyond these goals to study user behavior more broadly is vital to understanding the overall digital experience, even if the primary and secondary goals targeted by your A/B experience will serve as the foundation of any A/B testing research.
For instance, how frequently did the visitors who converted in your test visit your website or make purchases? What marketing materials are they most likely to interact with? Has a user’s response to the test been different if their previous website behavior was different, or if they had viewed several products in the three months leading up to the test?
These are the kinds of inquiries that will be far simpler to explore within GA4.
Convert Experiences users, read on to learn how to integrate GA4 with Convert Experiences.
How to Send Convert Experiences Data to GA4
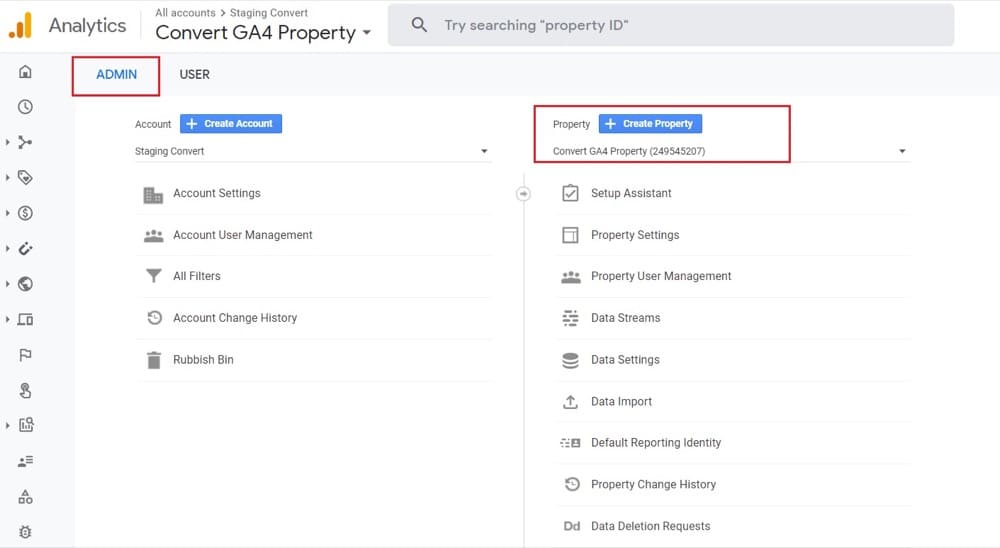
1. Create a GA4 property
Go to the admin area of your GA account and create a GA4 property.
2. Add a Web Data Stream to your new GA4 property
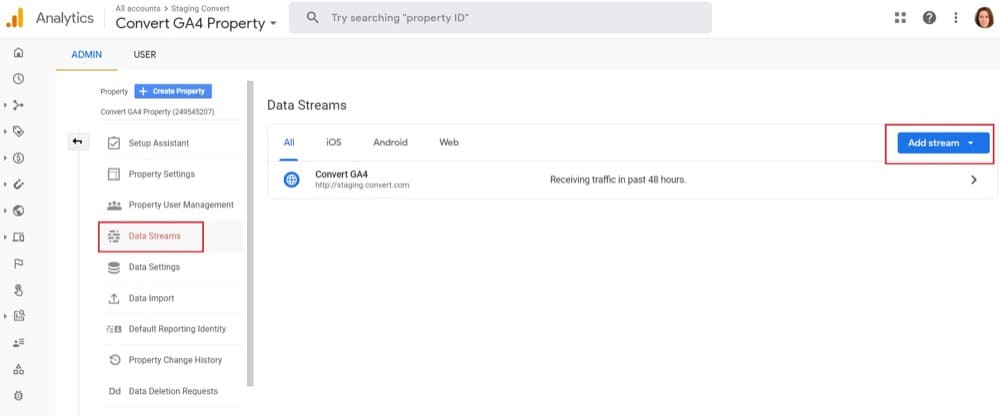
Enter your URL and website name as requested.
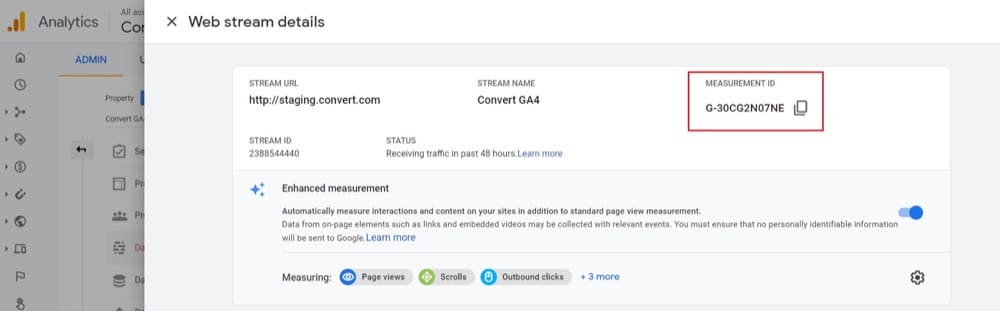
After entering the required site information, you will be given a Measurement ID: G-XXXXXXXX (example below).
You’re probably wondering how many data streams you’ll need. Try going with one web stream initially, you can always add more later.
3. Add Tracking Codes
Make sure both the Convert Tracking code and Google Tag Manager code are added to your website.
4. Push Convert Data to the GTM Data Layer
Convert Experiences fired on pages are pushed into the Google Tag Manager default dataLayer object for further processing inside GTM. You don’t need to do anything here.
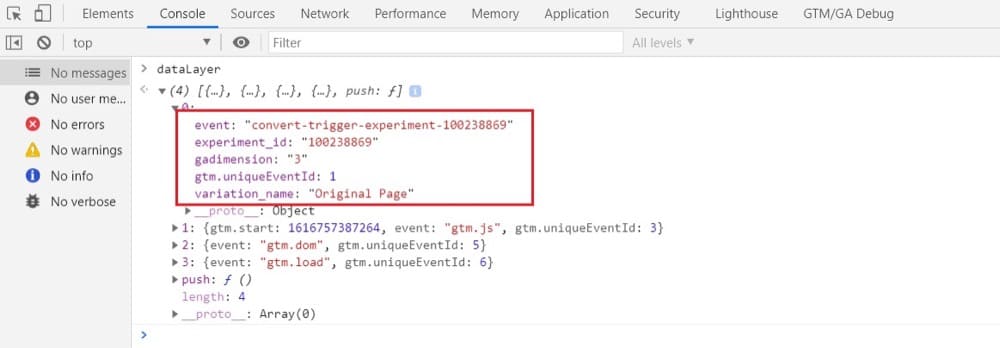
Here are the 4 keys of the Convert object pushed to GTM dataLayer:
- “event” – “convert-trigger-experiment-{experiment_id}” where experiment_id is the ID of the fired experiment inside the Convert Experiences app;
- “experiment_id” – the experiment id of the fired experiment inside Convert Experiences app;
- “variation_name” – the variation name of the selected variation, as found inside the Convert Experiences app
- “gadimension” – if the Google Analytics integration has been enabled and a dimension chosen then it has the value for the dimension set in the Google Analytics integration.
Example:
dataLayer.push({ "event":"convert-trigger-experiment-1234", "experiment_id":"1234", "variation_name":"test variation", "gadimension":"1" });
If you use the Google Chrome Developers Tool console and you have activated the Convert Debugger extension, this is how it looks like when Convert pushes data to the GTM data layer:

Inside Google Tag Manager, this data can be used and sent forward to other services that are supported. In this case, we will send the data to GA4.
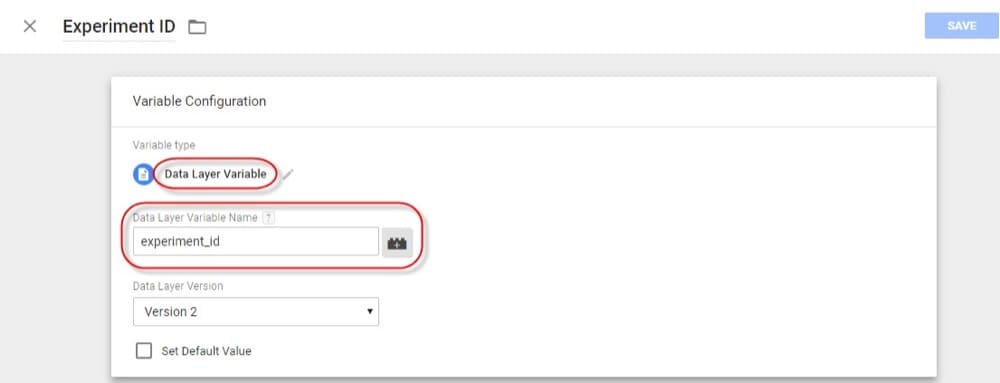
5. Create the Experiment ID Data Layer variable in GTM
The Experiment ID Data layer Variable will store the Convert experiment_id values and we will use it every time we need to call this value.
Open Google Tag Manager and go to variables:
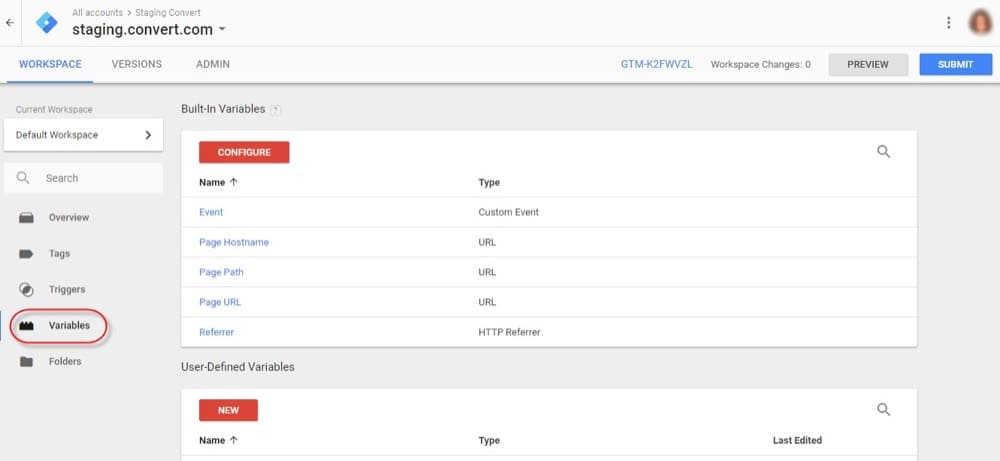
Create a new User Defined variable:
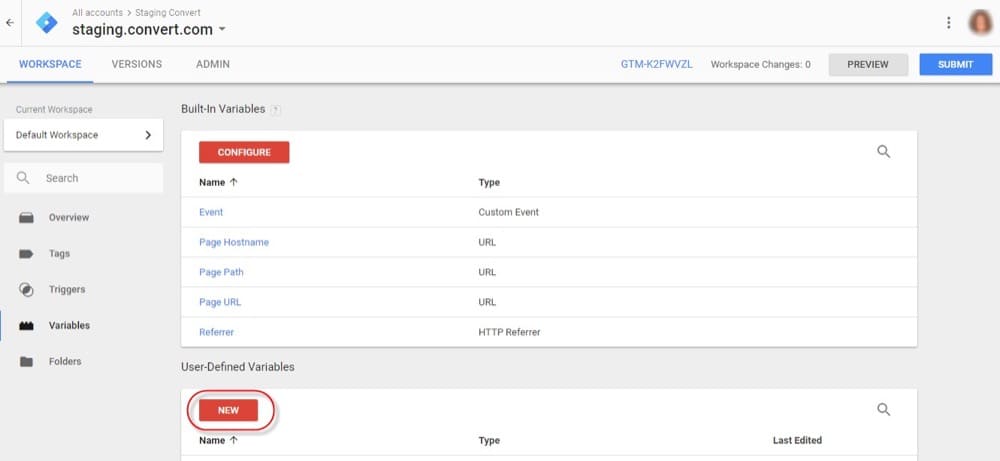
Give it a descriptive name, assign the type Data Layer Variable and fill in experiment_id in the Data Layer Variable name:
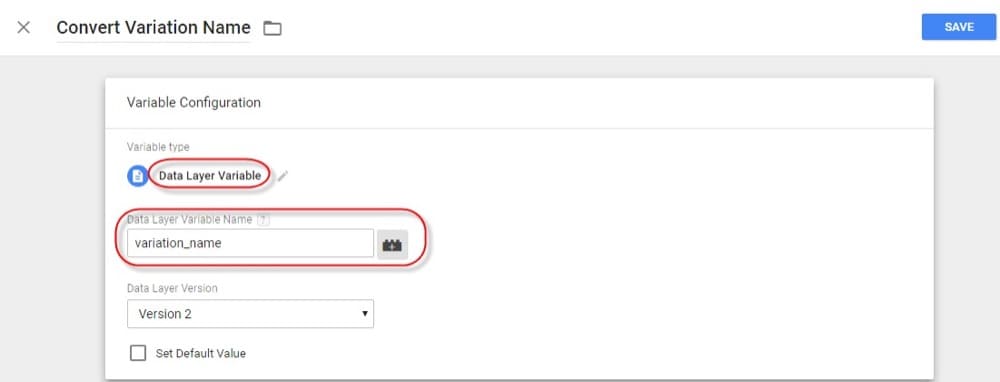
6. Create the Variation Name Data Layer variable in GTM
The Variation Name Data Layer Variable will store the Convert variation_name values and we will use it every time we need to call this value.
Go to variables and create a new User Defined variable:
Give it a descriptive name and assign as type the Data Layer Variable. Specify its Data Layer Variable name and hit Save:
7. Create a new GTM Tag and its Firing Trigger
Go to tags and create a new tag:
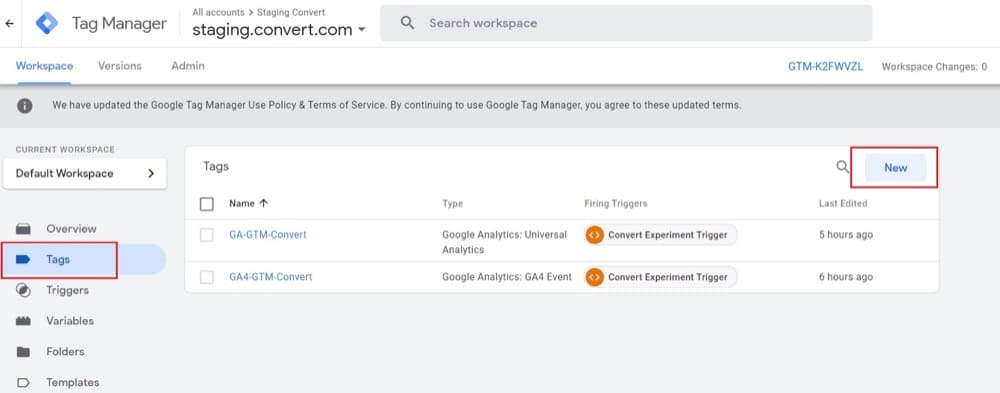
Give it a descriptive name and select the GA4 Event as your Tag Type. Select Manually Set ID as your Configuration Tag and fill in the Measurement ID you got from your GA4 property:
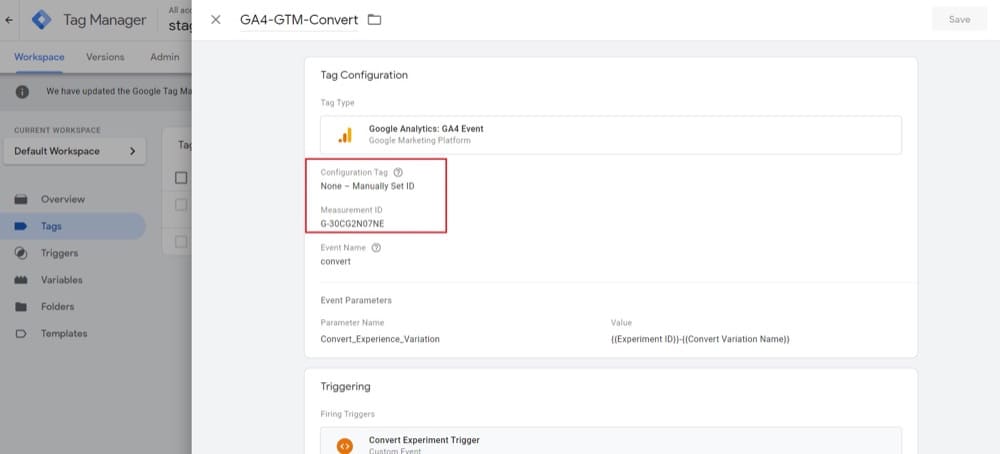
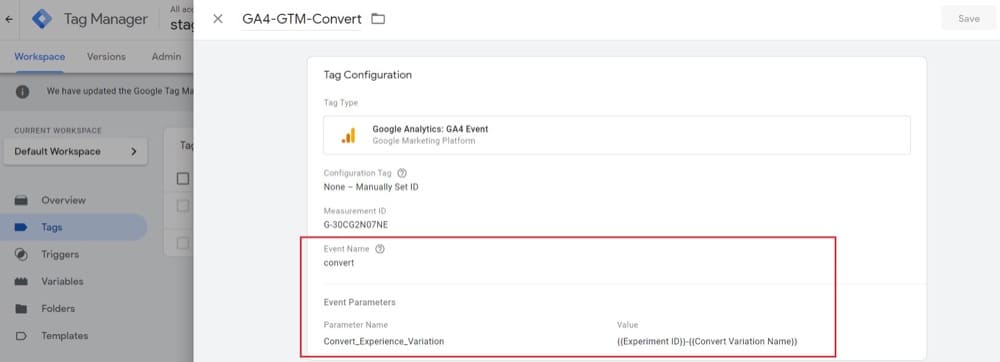
Add an event name. Combine the two data layer variables we created above as an event parameter. If you prefer, you can have two event parameters (one for the experience_id and one for the variation_name):
Select the triggering rule to fire the tag. Create a new trigger, give it a descriptive name, select Custom Event and fill in relevant fields as it is shown below:
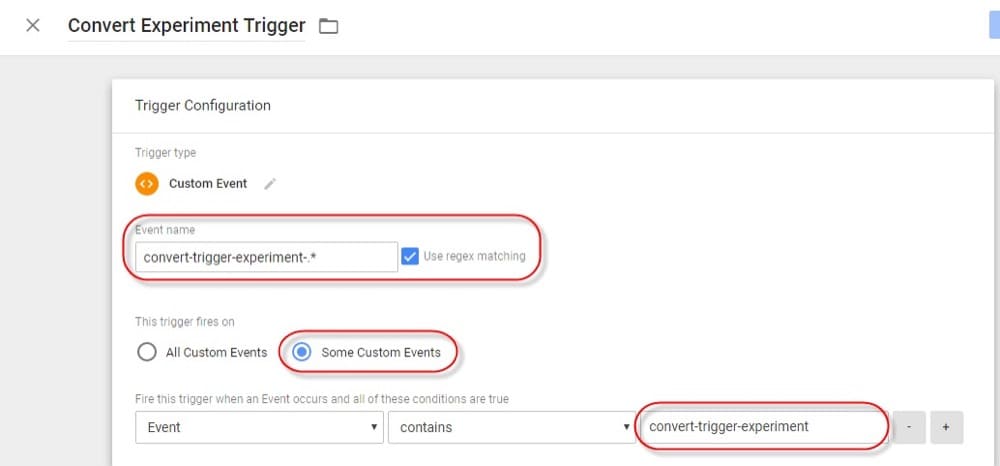
Please note that this rule will fire the tag every time an experience is fired.
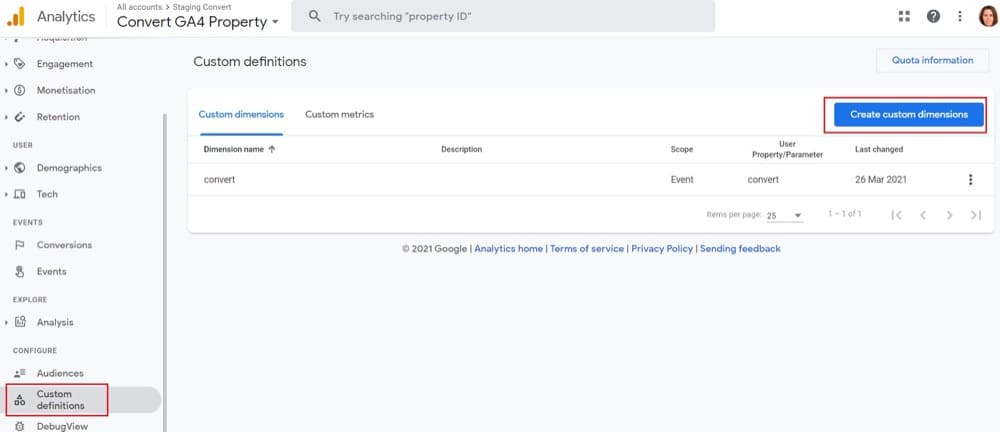
8. Register the Custom Definitions in GA4
Any custom parameter you give to GA4 is subject to this. You must register custom parameters in the GA interface if you wish to view or use them in applications like Funnel reports, Exploration, see their reporting cards in regular reports, etc.
We need to register it here because we submitted a custom parameter along with the Convert event.
You can find custom dimensions in GA4 under Configure > Custom Definitions:
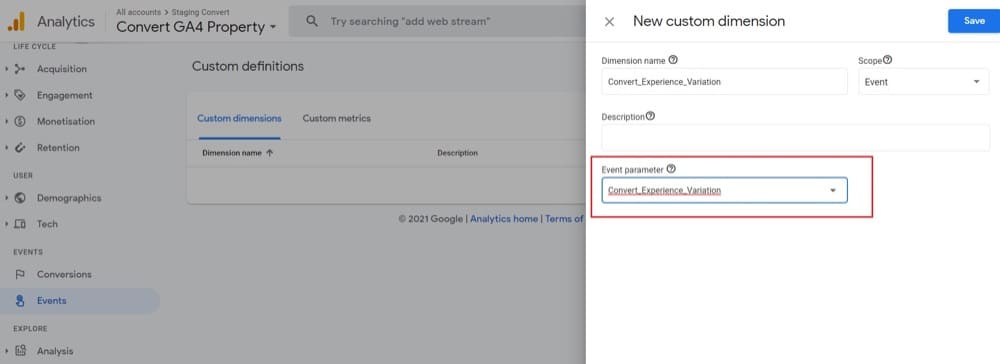
You will see the changes in the user interface about 24 hours after data has started collecting for this parameter.
9. Check Convert Data in your GA4 reports
You can view your Convert data in GA4 using the following reports:
- All Events reports
- Debugger
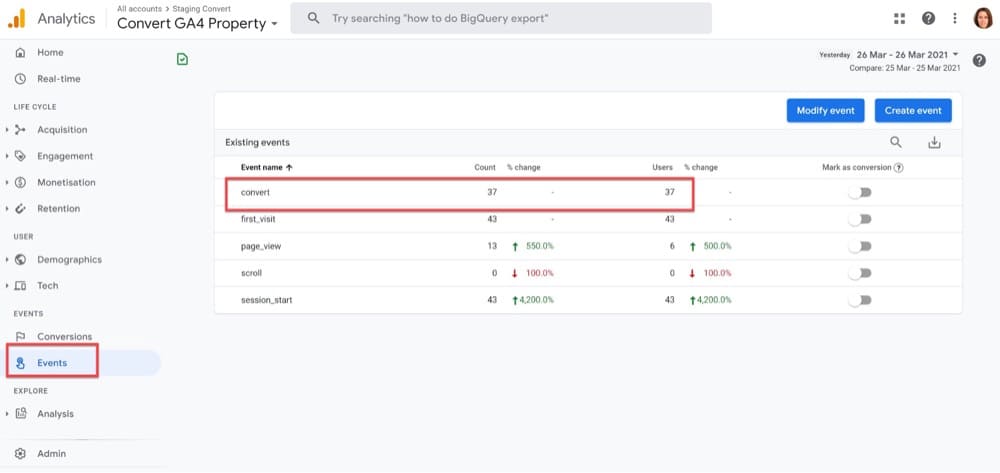
- Engagement > Events
- Analysis > Analysis Hub
That is not all, though. Because GA4 is an event-based analytics platform, events you send will have an impact on every report (in one way or another).
- Events
This is where you can find a list of all the events that your GA4 property is tracking. Click on any event for a more detailed report. There might be a delay of up to 24 hours before your custom events appear on that list.
- Debugger
When debugging is enabled on a device or browser, DebugView can be used to monitor its activity.
To try it out, enable debug mode on a computer or browser. Then, click DebugView in the right navigation panel to keep track of the events coming from that computer or browser.
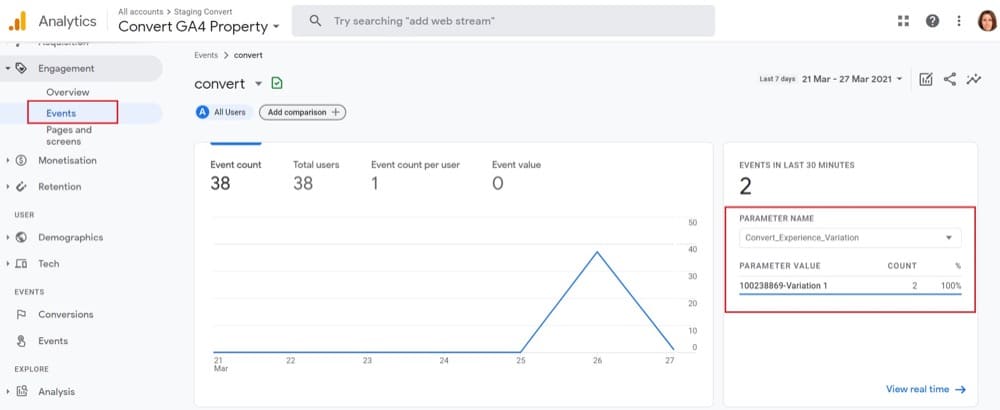
- Engagement > Events
This includes several charts as well as a summary of all events that were sent to your property. If you click on any of the events listed below them, you will be taken to the same kind of report that was indicated in the report section for “All Events”.
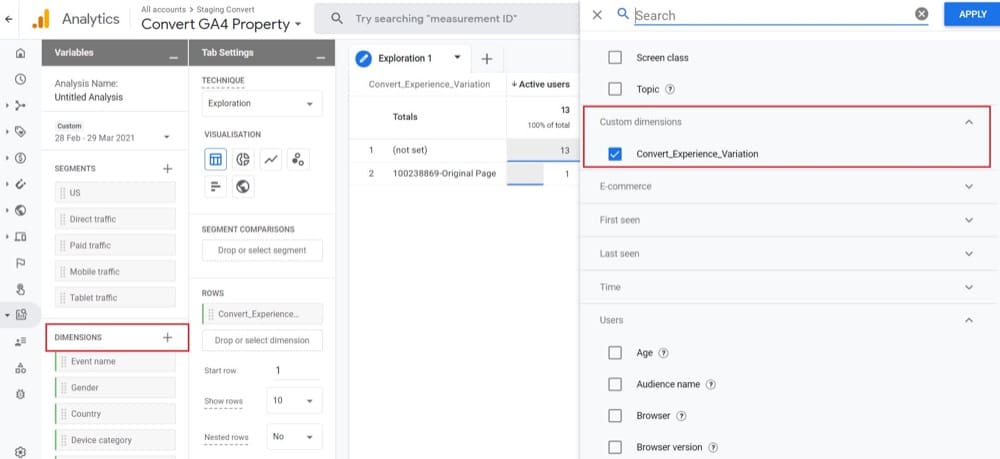
- Analysis > Analysis Hub reports
This is the area where you can drill down into your data. You can use reports like Exploration, Funnel Analysis, Pathing, etc. in the Analysis Hub.
Here is an example of an exploration report. Please be patient if you don’t see the information right away. The data may appear in your reports within 24 hours.
How to Send VWO Data to GA4
According to your use case, VWO has two guides on how to integrate GA4:
How to Send Optimizely Data to GA4
Optimizely offers several guides on how to integrate Optimizely Web or Full Stack with GA4:
- Integrate Optimizely Web with GA4
- Integrate Optimizely Web with GA4 using Google Tag Manager
- Integrate Optimizely Full Stack with GA4
How to Send Google Optimize Data to GA4
If you are using Google Optimize and would like to migrate to GA4, this is the guide for you. Rumour has it that Google will sunset Optimize next year, so you might want to think about your other options.
How to Send Kameleoon Data to GA4
If you are using Kameleoon and would like to migrate to GA4, check out this guide.
GA4 A/B Testing Data: How Can You Use It?
Your A/B data has been synced to GA4, but what’s next? Here are some common use cases to guide you.
Create Segments to Gain Deeper Insights
You can customize your reporting by adding segments. Results can be sorted by most popular pages, traffic sources, demographics, visitor types, locations, browsers, devices, etc. Additionally, you can include or exclude specific data types using filters.
Most A/B testing platforms just send event data that include experience and variations names that a visitor is bucketed into. You can use that event information and design your own unique segments.
Segments were present in most basic and custom reports in UA. Adding more segments, comparing them, and switching between reports were all possible.
Things are different in GA4.
Segments can only be added or used in Explore reports like Free Form, Funnel Explorations, etc.
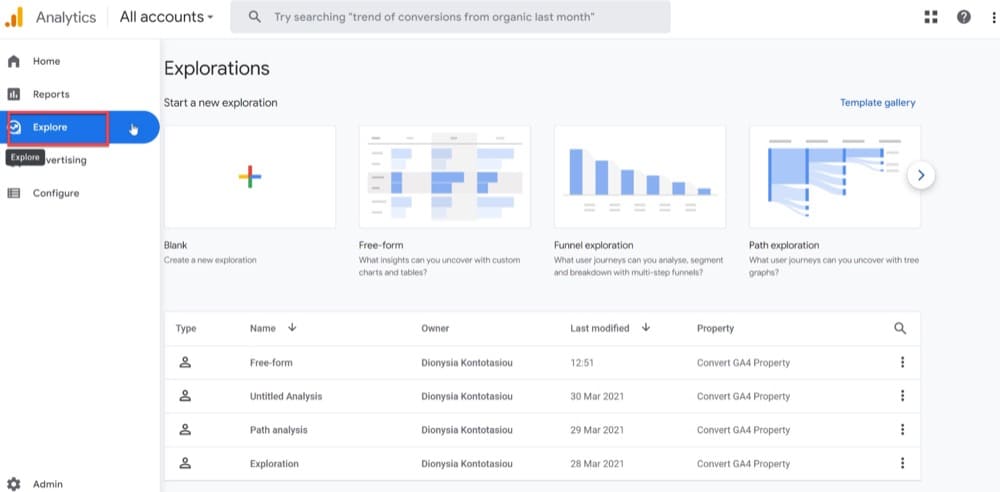
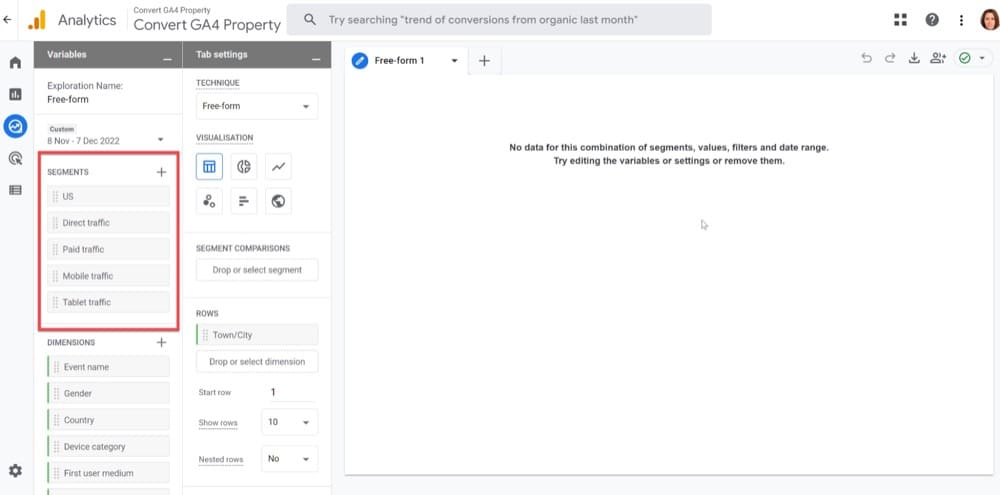
You can choose one of the suggested segments or create your own (by selecting Custom Segments).
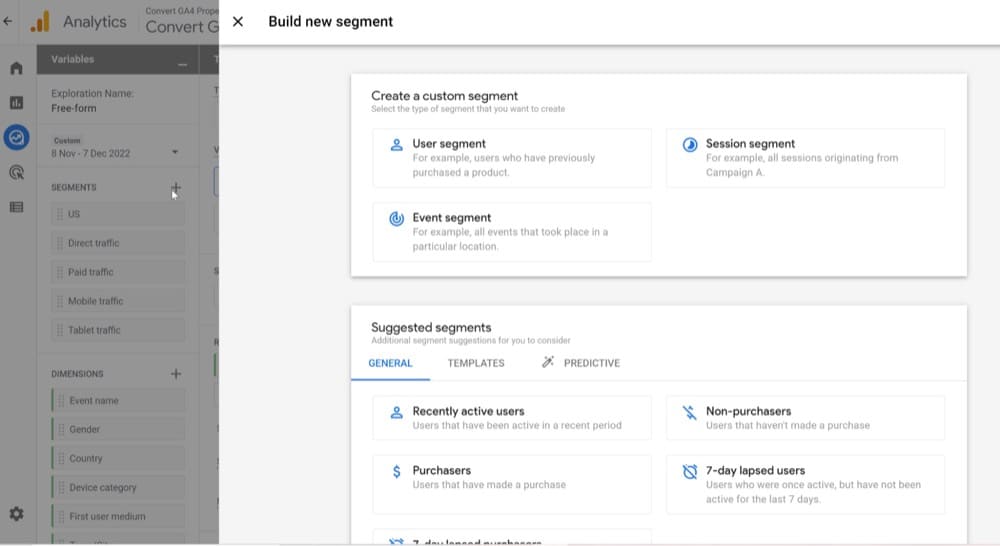
For example, using e-commerce events, you can create a segment for users who participated in experiences and made a purchase:
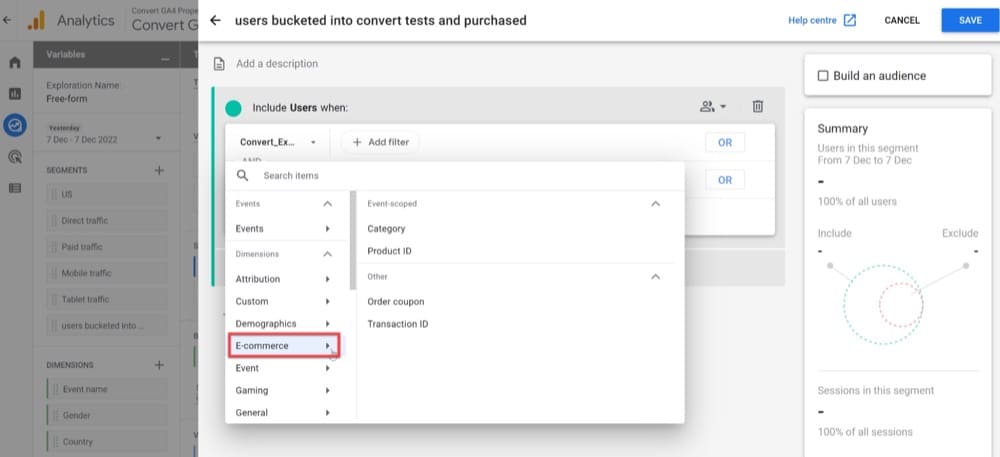
By using this segment, you can learn a lot about user-level purchasing behavior:
- What path(s) do customers who purchase take?
- Which regions have the highest conversion rates and average order values?
- What is the breakdown of the number of sessions over a month?
Create Custom Funnels to Demystify User Behavior Throughout the Entire Funnel
Understanding where your customers leave the funnel will help you improve those parts of the customer experience. Funnel Exploration reports can help you do that.
With the Funnel Exploration report, found in the Explore section of GA4, you can create funnels for any navigation path on your website. While the feature may take a bit of time to become familiar with, it offers some interesting features that are far superior to anything we’ve seen in UA so far.
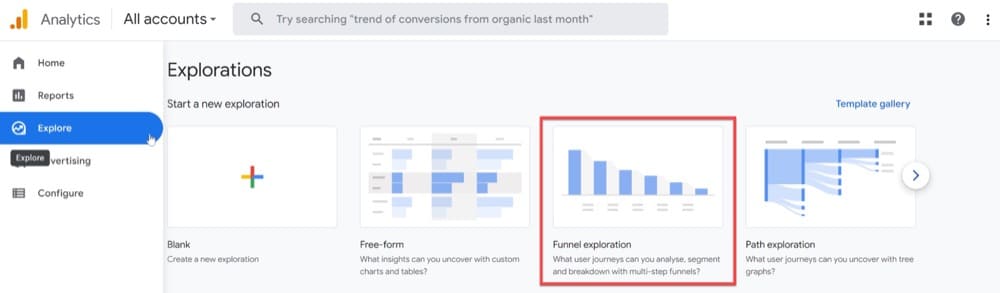
Let’s look at a sample funnel exploration report. It allows us to track the number of visitors who are bucketed into the variation of a test, look at at least one product (on the product page), add an item to their shopping cart, and ultimately complete a transaction.
Note: To run this report, your GA4 property must be configured to track Ecommerce.
In this example, the steps would be as follows:
- convert_experience_variation (this name is required by the GA4-Convert integration)
- view_item (this name is required by the GA4 ecommerce tracking)
- add_to_cart (this name is required by the GA4 ecommerce tracking)
- purchase (this name is required by the GA4 ecommerce tracking)
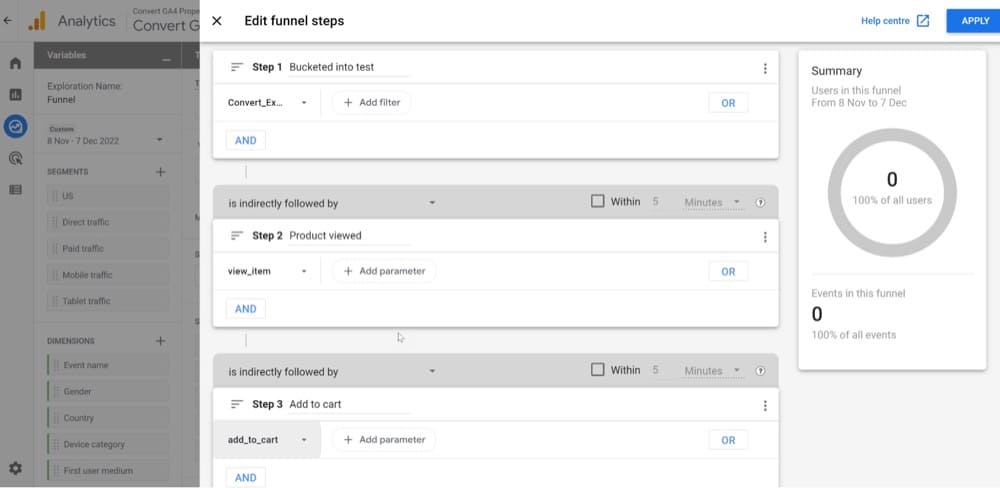
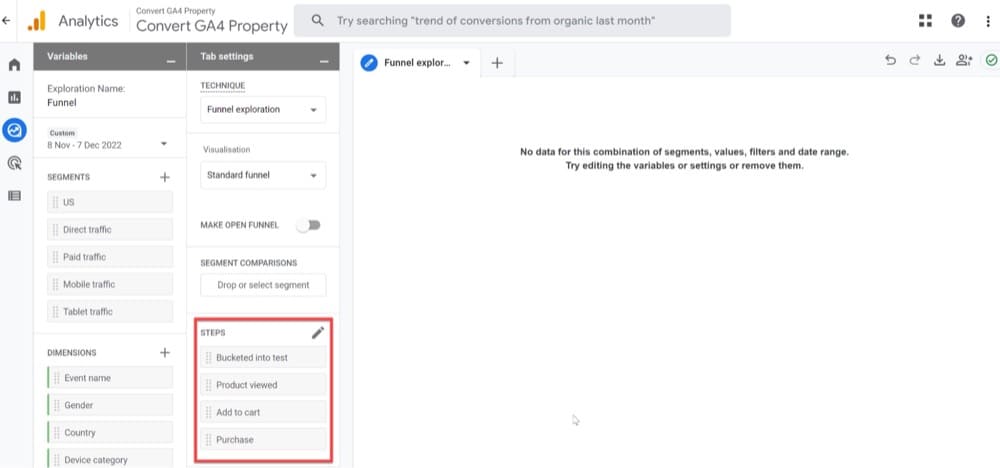
The other settings are left unchanged. After everything has been set up, here are the tab settings.
Send Your A/B Testing Data to Google Sheets
Let’s say you’re working on a project for a customer that uses Convert to test various funnel flows. They want to test new layouts and optimize for mobile. Your Convert dashboard already contains all the necessary data, but you may choose to create the dashboard in Google Sheets because:
- You want to change the dashboard’s layout so that you can quickly view the most important information.
- Not everyone in the organization has Convert collaborator permissions to view the reporting dashboard.
- In your analysis, you want to offer some additional support outside of Convert, like a histogram.
In such cases, Google Sheets can be helpful, due to its JavaScript-based scripting language and its vibrant ecosystem of add-ons in the G Suite Marketplace. Numerous add-ons link Sheets to well-known services like Facebook and Google Analytics (Supermetrics and Two Minute Reports are among the most popular ones).
Users are able to pull in data with a click of a button, enabling some automation without the expense and complexity of a comprehensive data warehouse.
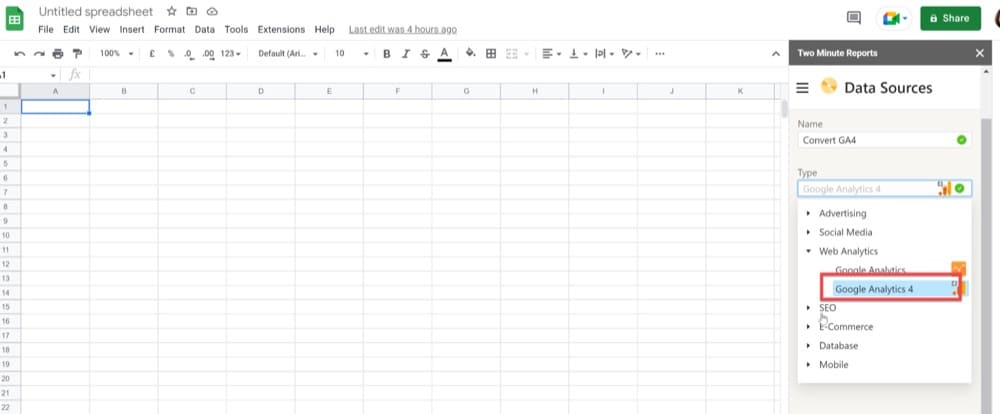
Add the Two Minute Reports Google add-on into your Google Sheet, and import your GA4 data source where your A/B testing data resides:
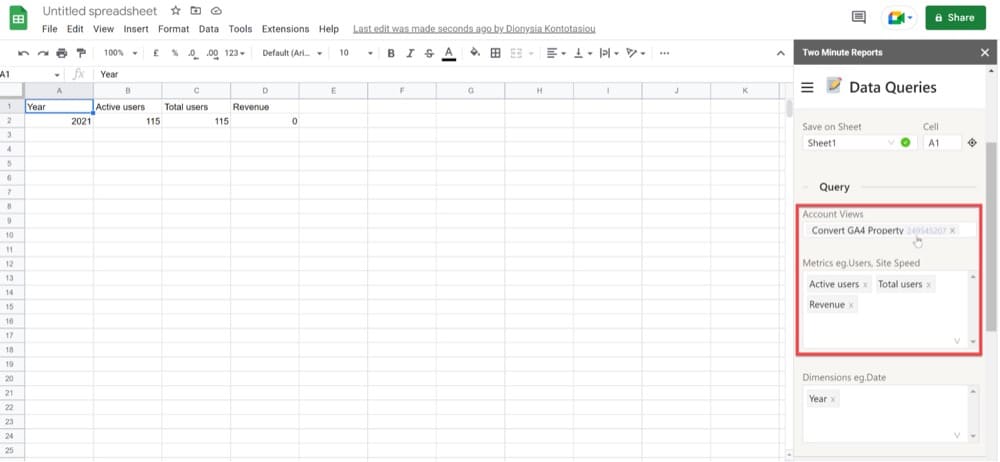
It is now possible to collect test data on a single page and add computations needed to analyze the test. Once the report has been created, you can share it with your colleagues by clicking the share button on the browser.
Next Steps
This is the perfect opportunity to get acquainted with GA4 so that you are ready to transition from UA to GA4 before it’s too late! As we’ve pointed out in this article already, there are quite a few things that need to be learned in advance, so now is an excellent moment to start.


Written By
Dionysia Kontotasiou

Edited By
Carmen Apostu
