How to Migrate Your Experiment Data Before the GO Sunset: With Convert’s 27-Second Data Migration Tool (& 8 Other Options)
As Google Optimize’s sunset approaches, testers everywhere are faced with the weighty task of preserving their precious experiment data. But, the success of this endeavor will hinge on the thought and care put into the data migration process.
In this article, I’m covering 9 tried-and-true methods for exporting your Google Optimize (GO) data, ensuring that your hard-earned testing knowledge is safeguarded.
Option 1: The 27-Second Google Optimize Data Migration Tool by Convert
Out of all the options presented in this article, this is the only one that gives you the import feature. So, if you’re looking to transfer your data into a new tool, Option #1 is the way to go.
Installing and using the Convert Experiences Tools Chrome Extension that comes with a GO Data Migration Tool is the fastest way to export GO data.
This extension helps you optimize your experience development, testing, and debugging through some key features:
- Shows you detailed logging of experiences’ activity on your website pages.
- Downloads the experience snippet directly from the Convert app servers which eliminates the delay of experience updates in the CDN server. Otherwise, you have to wait up to 5 minutes for the updates to be reflected on your web pages.
- X-frame-security-header-options removed to allow you to see more sites in the Visual Editor.
- Chrome SameSite strict cookies are modified for the white-listed sites so you can see iframes and other parts of your website in the Visual Editor.
- Imports your GO experiences into your Convert account.
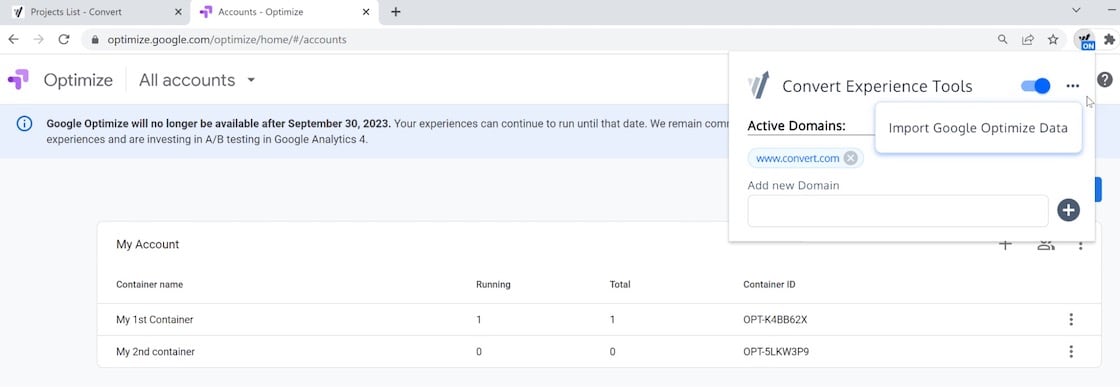
First, install the extension into your Chrome browser. After it is installed and enabled, you will see a Convert icon in the toolbar. To turn on the extension, click on it and toggle the switch from OFF to ON.
Select the 3-dot icon and the option to “Import your Google Optimize data” will be visible:
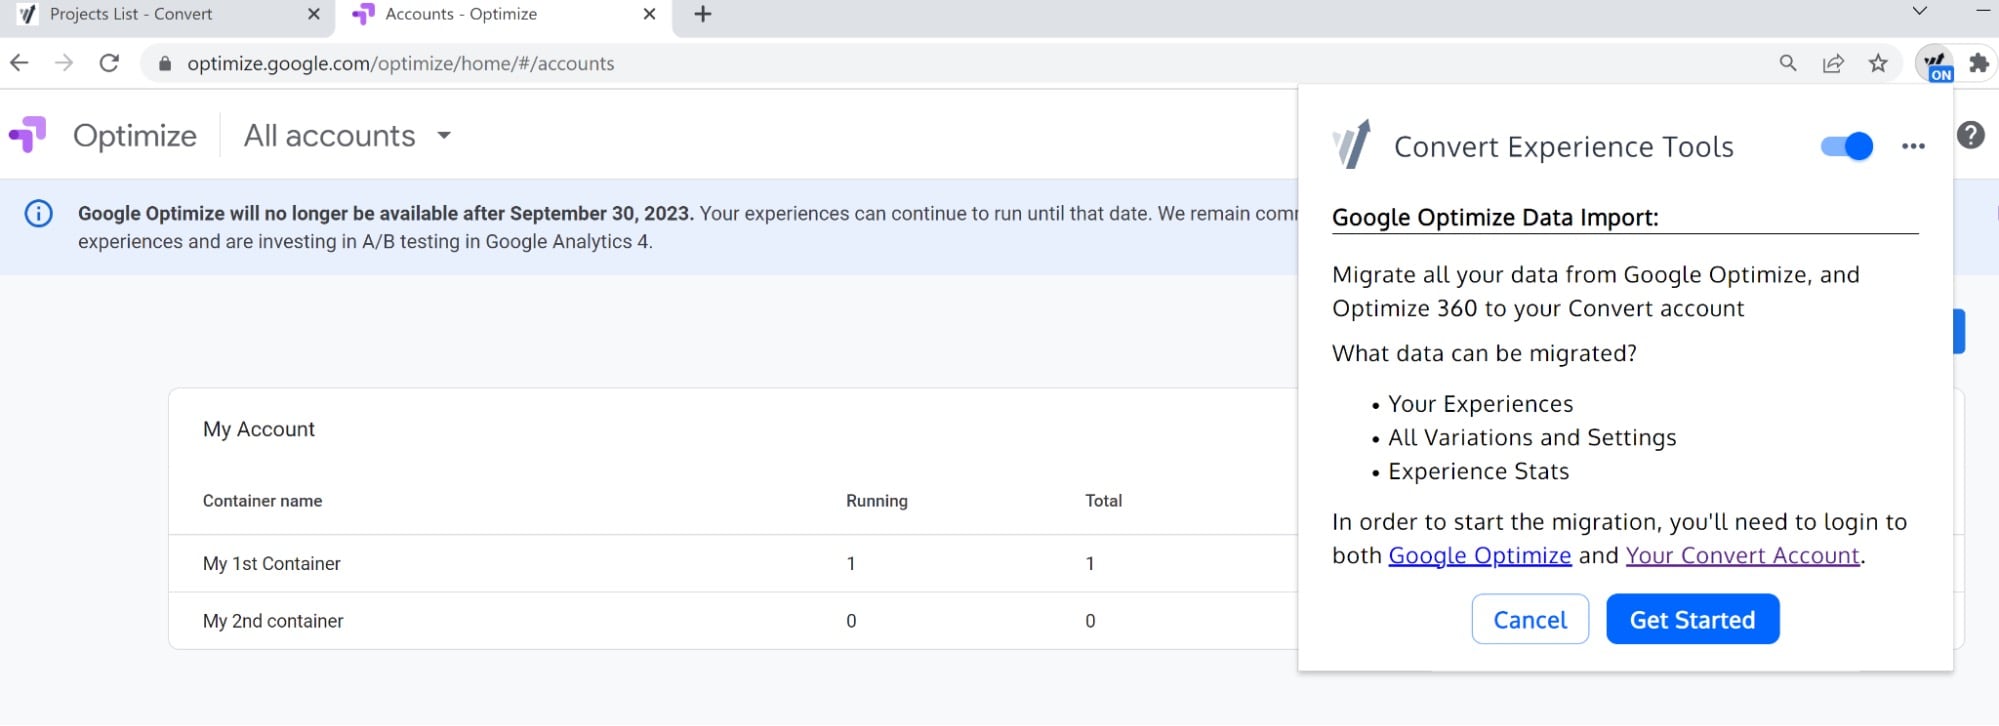
Click on the “Import Google Optimize Data” option and then on the “Get Started” button:
You need to be logged into both platforms (Google Optimize + Convert.com), otherwise the import cannot be started.
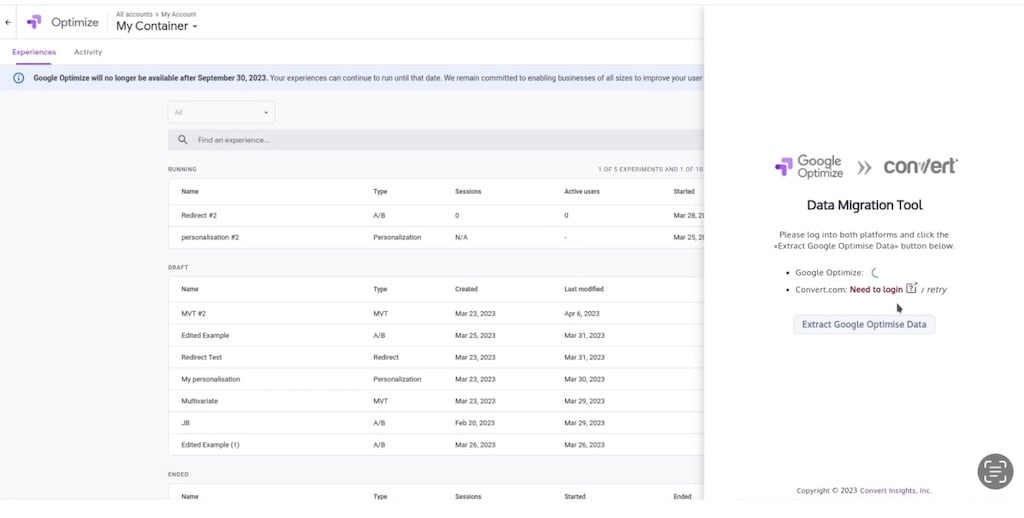
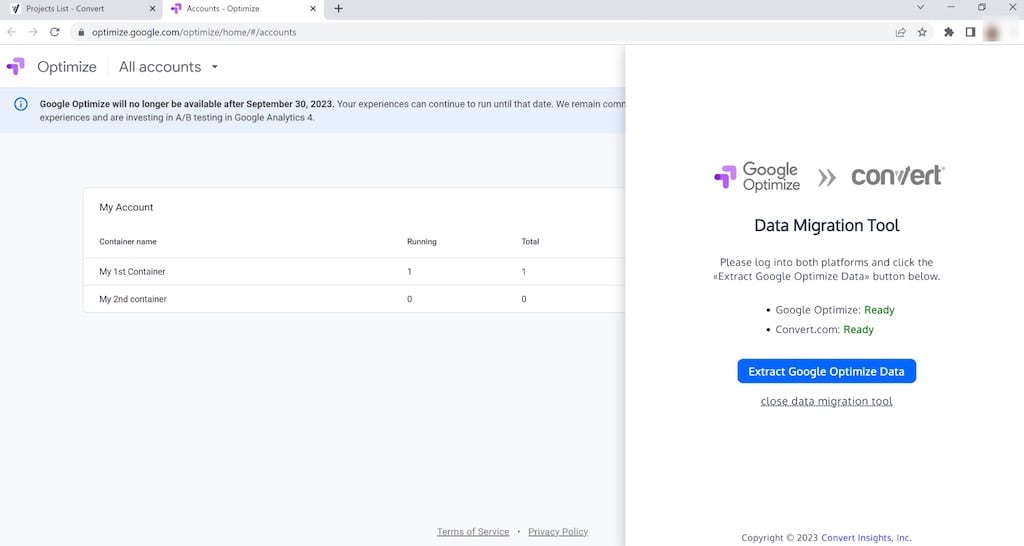
Click the “Extract Google Optimize Data” button:
Select your destination Convert account.
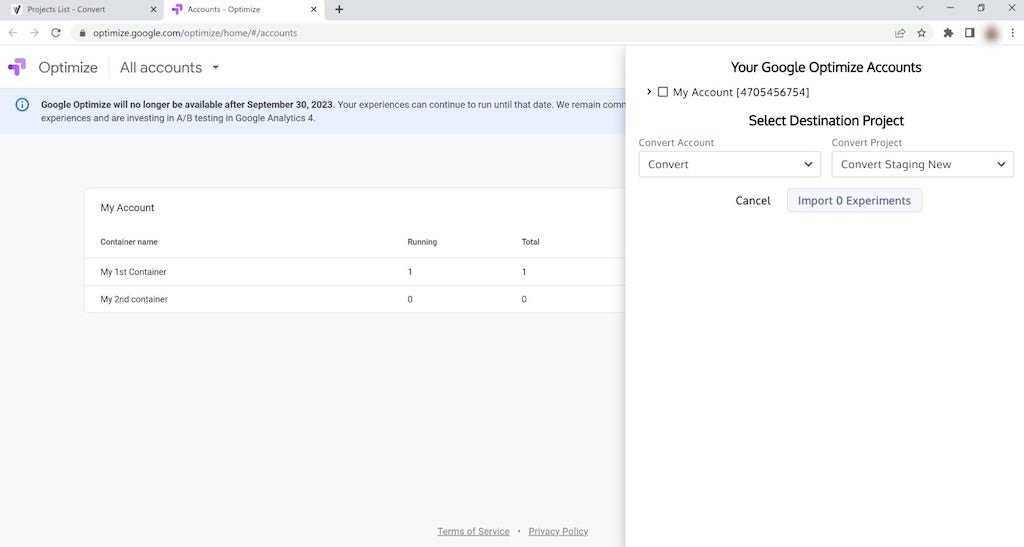
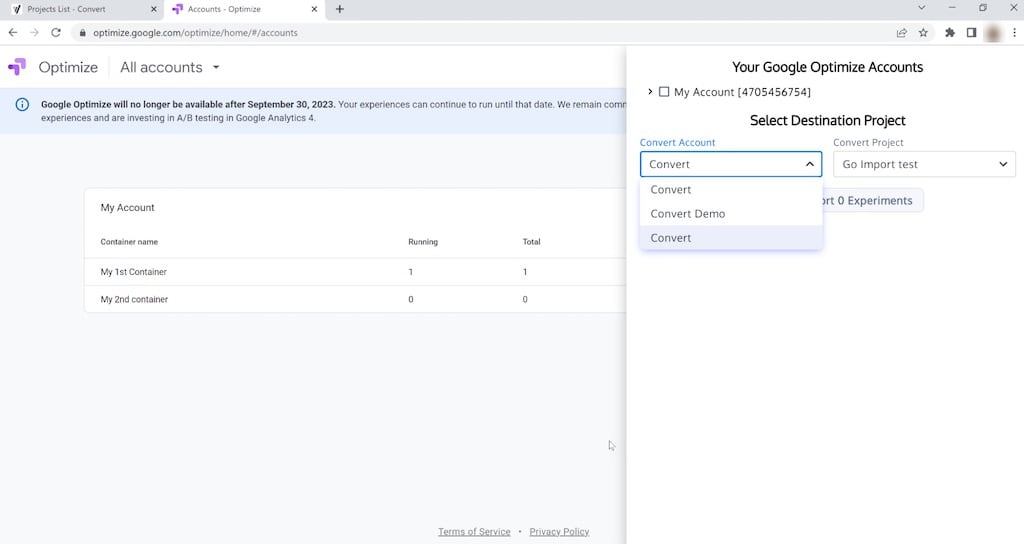
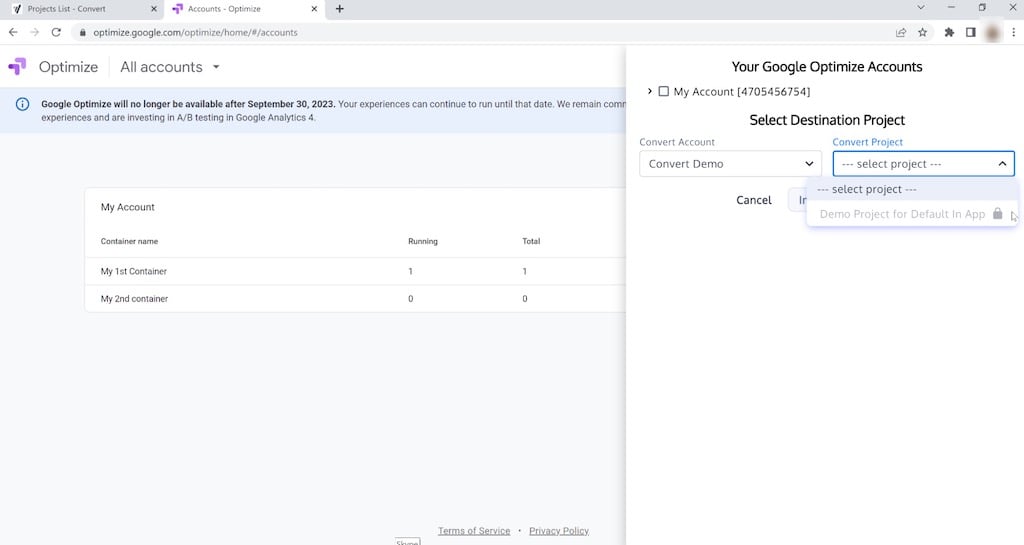
You will notice that it’s not possible to select the Convert demo account (that comes by default with all Convert accounts) as this is including experiences of different types (A/A, A/B, Split URL) and statuses (Scheduled, Paused, Active, Draft, etc).
This project is a read-only project and meant for you to test, explore and discover more about Convert Experiences and its features:
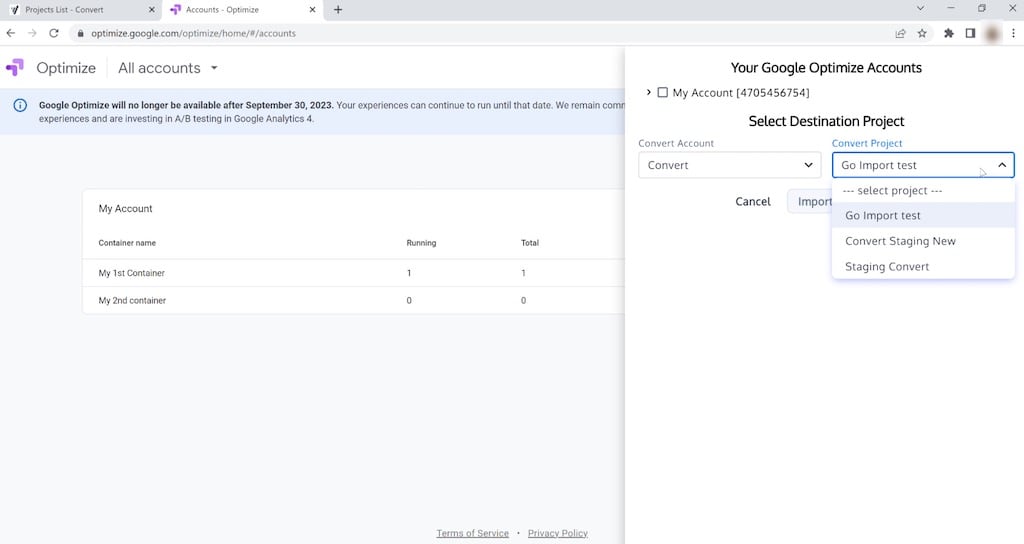
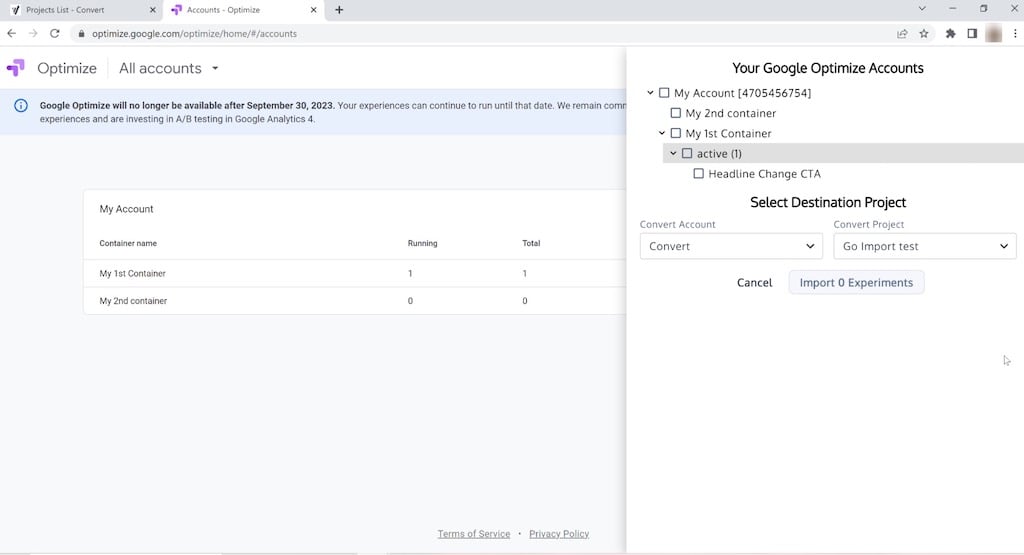
Select the destination Convert project where you would like to import your GO experiences. Ideally, you can create a new project that will be solely used for the GO imported tests:
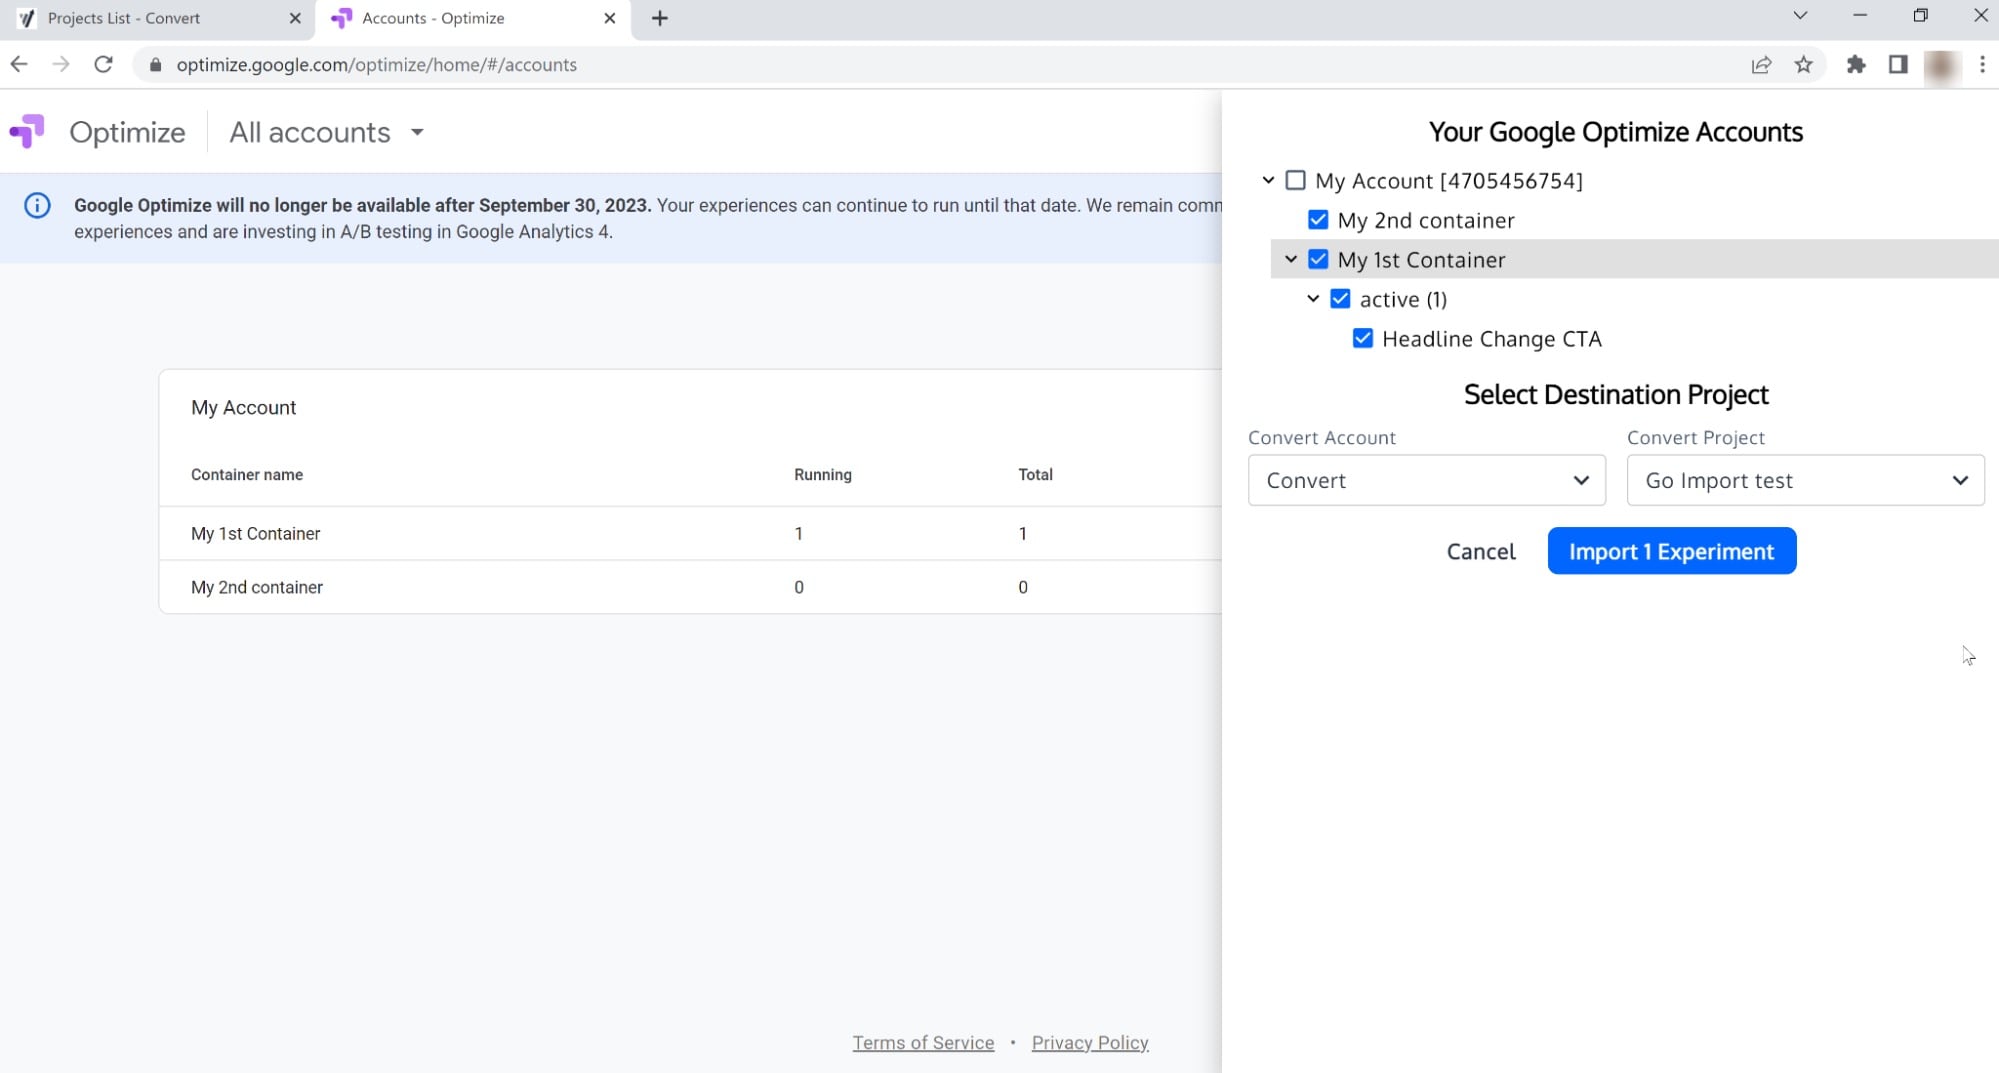
Then, select the experiences from the GO accounts that you want to import:
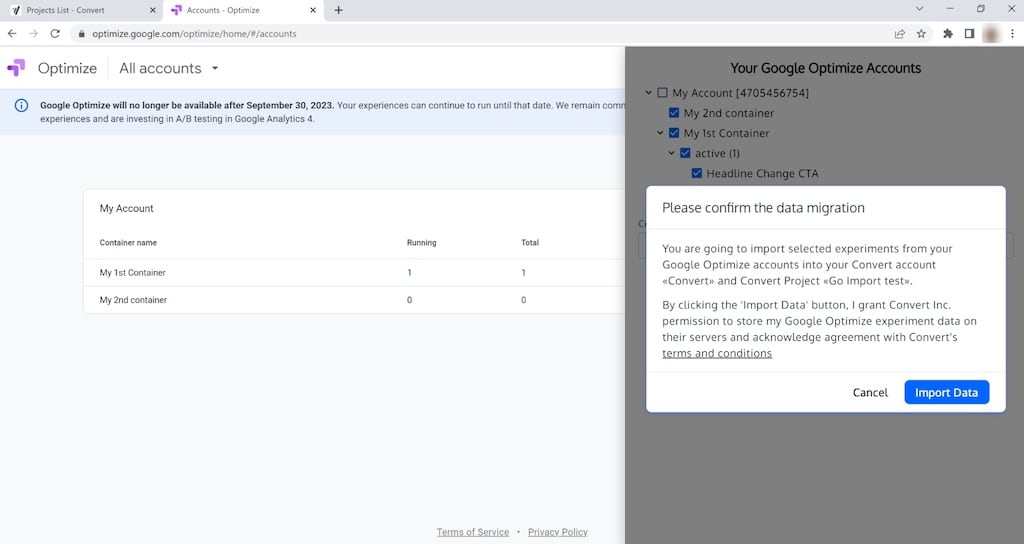
For privacy and security reasons, you need to confirm the data migration that is going to happen by clicking the “Import data” button:
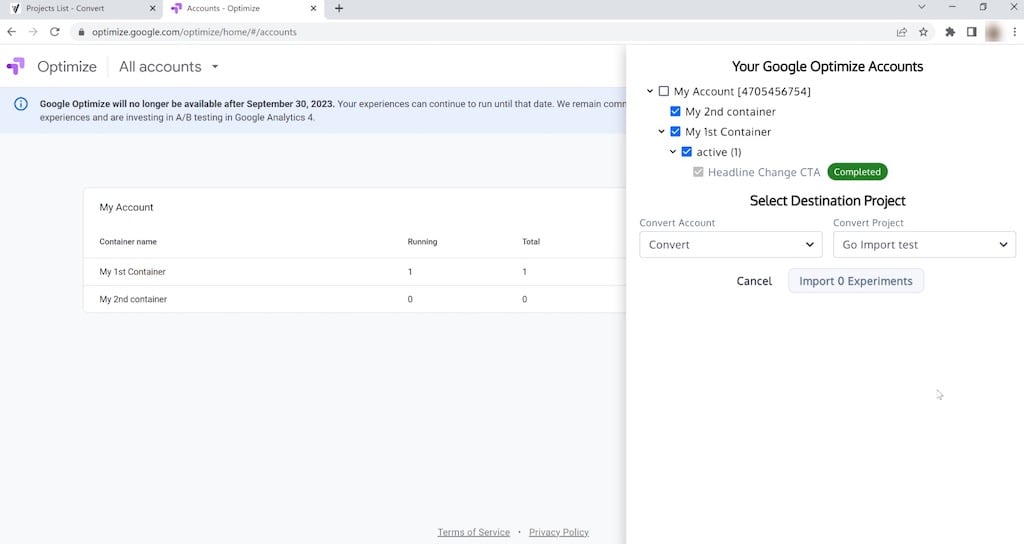
Once the GO data is imported, you will notice a green Completed tag next to the experiences:
And you will be able to view them in your Convert Experiences tab:
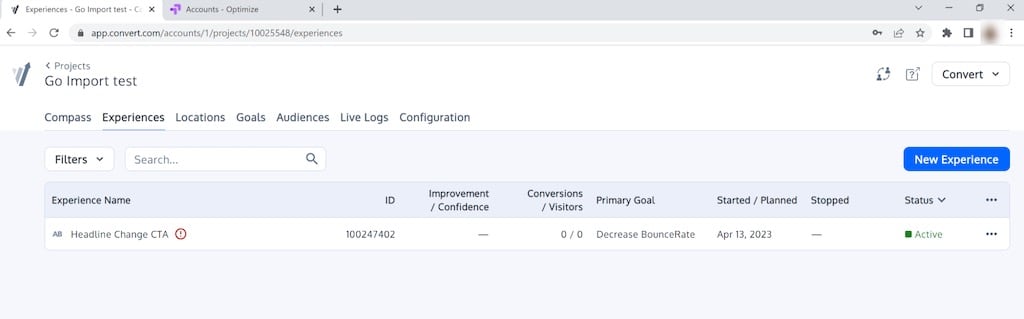
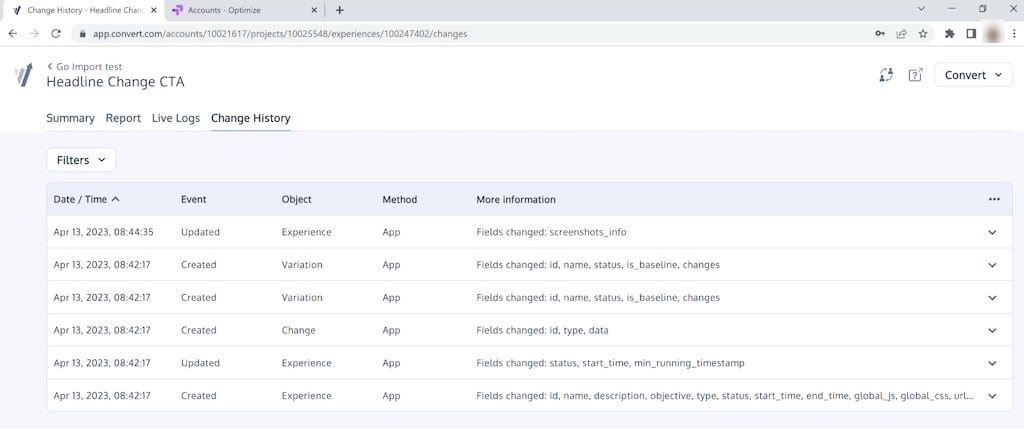
Navigate to the Change History tab to see all the changes that took place:
Open the Visual Editor and see that both visual changes and code changes are present:
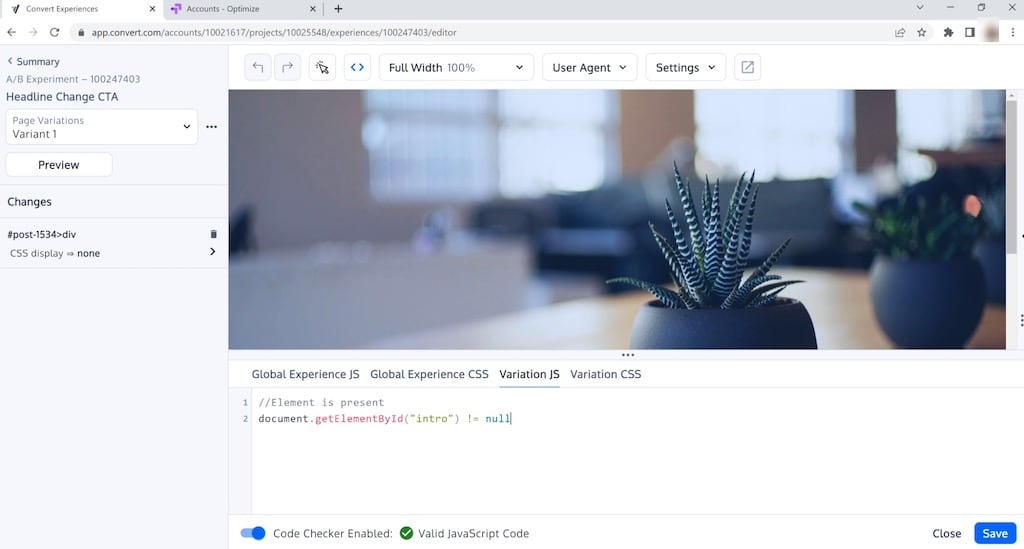
The entire process is done in less than 30 seconds.
Now you can pick up where you’d left off! Continue iterating on the changes made to the variants and test like you were never disrupted.
You now have access to all Experiments, their data, variations and their settings.
Option 2: CSV Download
From here on out, we’ll explore export options. Starting with the most common and straightforward one, exporting your GO data for analysis as a CSV file.
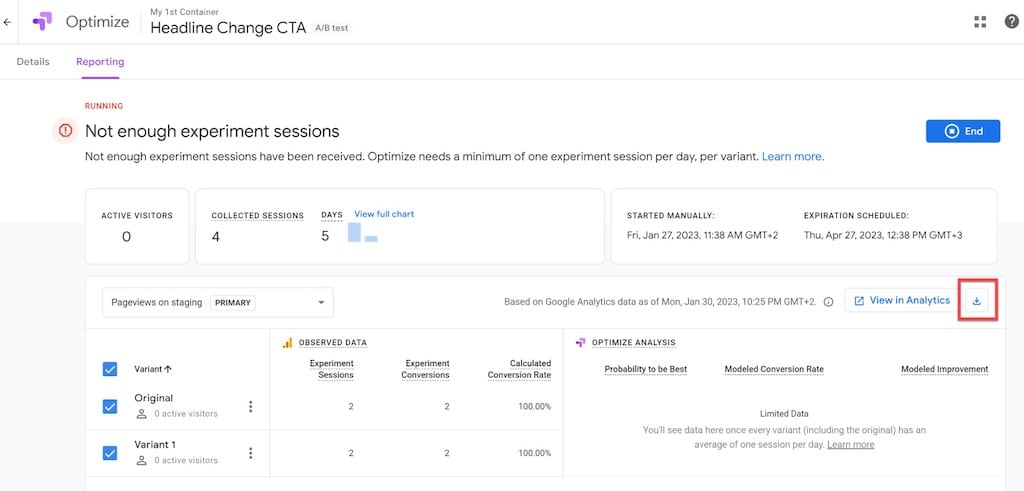
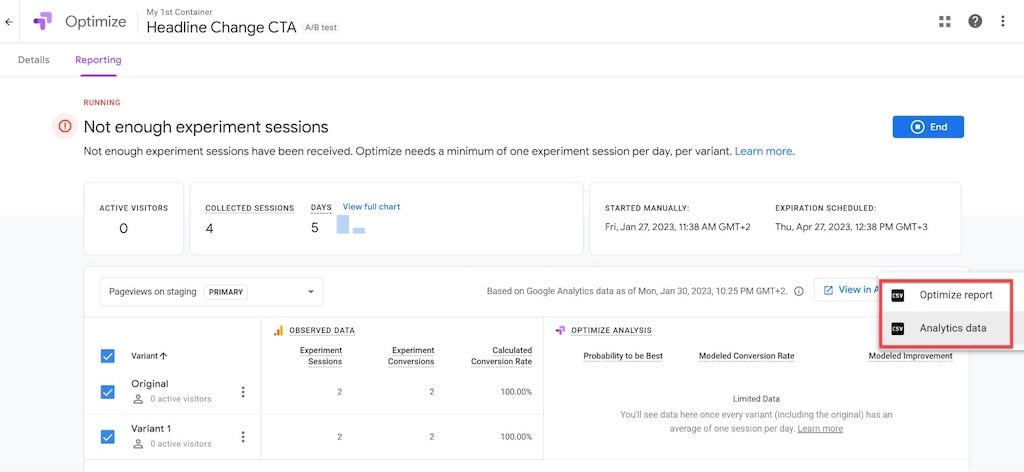
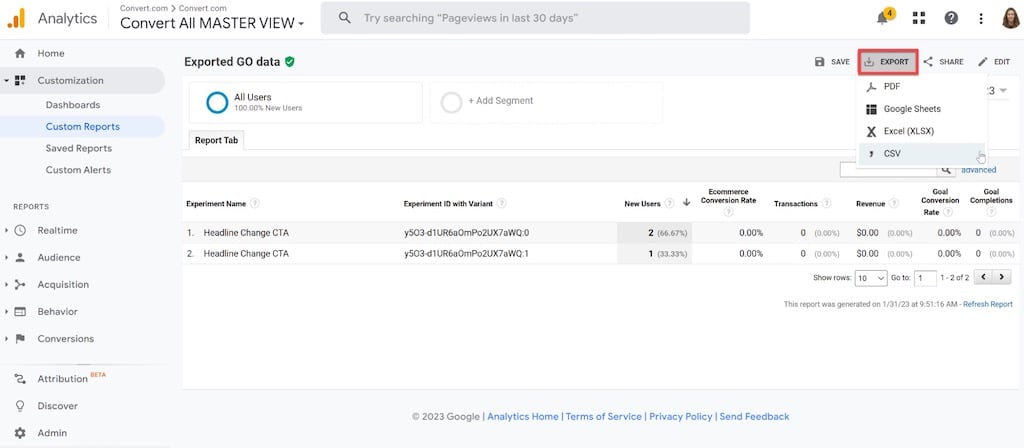
After your experiment is complete, click the download icon, then choose between two options:
- Optimize report: gives you a GO analysis of your variants
- Analytics data: is available for each of your variations, broken down by day.
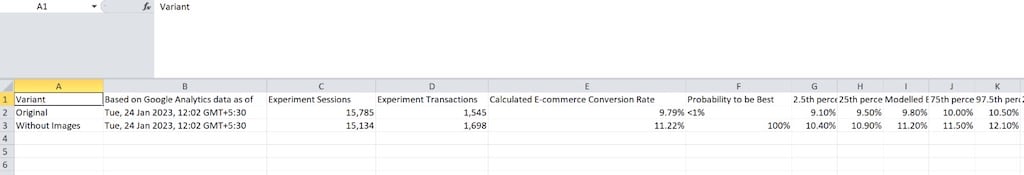
Here’s what your data export will look like:
Option 3: Google Analytics (GA) Custom Reports
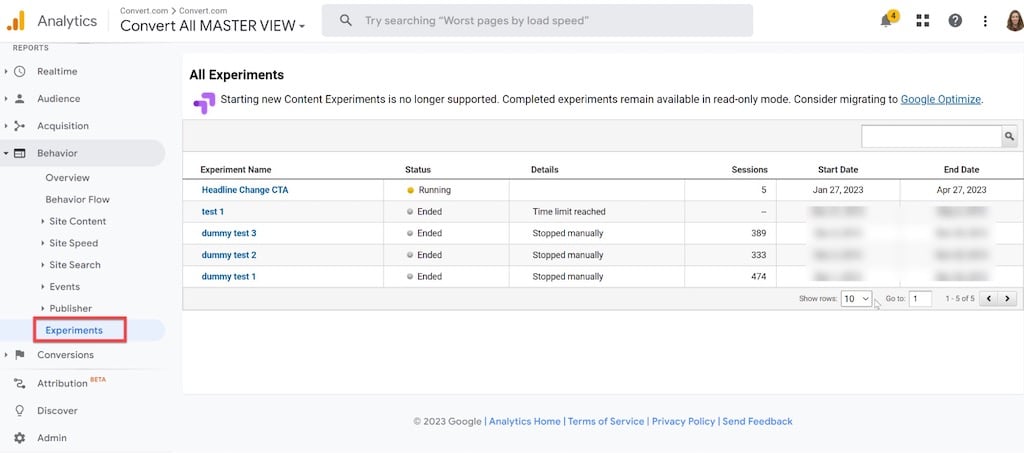
In that same Reporting tab, select the “View in Analytics” option (next to “Download”) to view your Optimize data in your Google Analytics account.
In the Behavior section, select the “Experiments” report. The Experiments report itself does not include export functionality, unlike many other GA reports. Below, I’ll explain a possible workaround.
Google Optimize will add three new Custom Dimensions to your Google Analytics reports when you set up an integration between the two tools.
- Experiment name: This is the name of your experiment in GO.
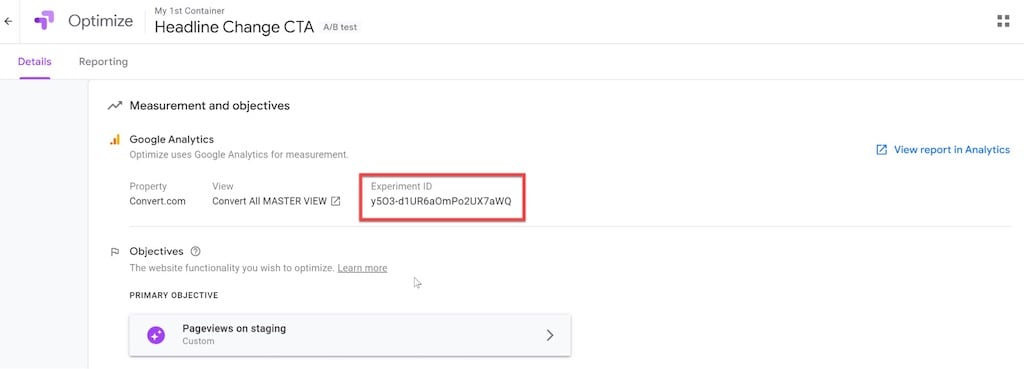
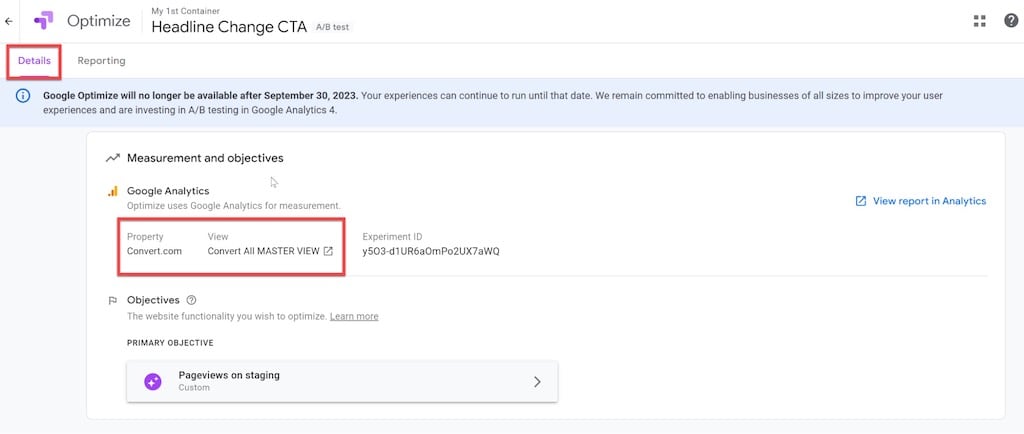
- Experiment ID: Your experiment’s GO ID. This is available on the GO experiment detail page.
- Variant: A variant is identified by its code number. For example, “0” represents “Control”, “1” represents “Variant 1”, “2” represents “Variant 2”, etc.
By using the above custom dimensions, you can export raw GO data from the GA Custom Reports instead of using the GA Behavior Experiments report.
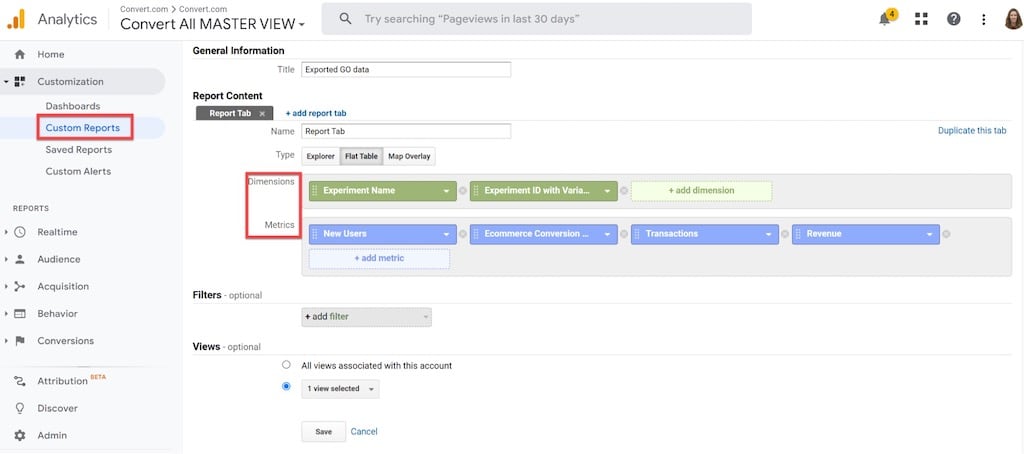
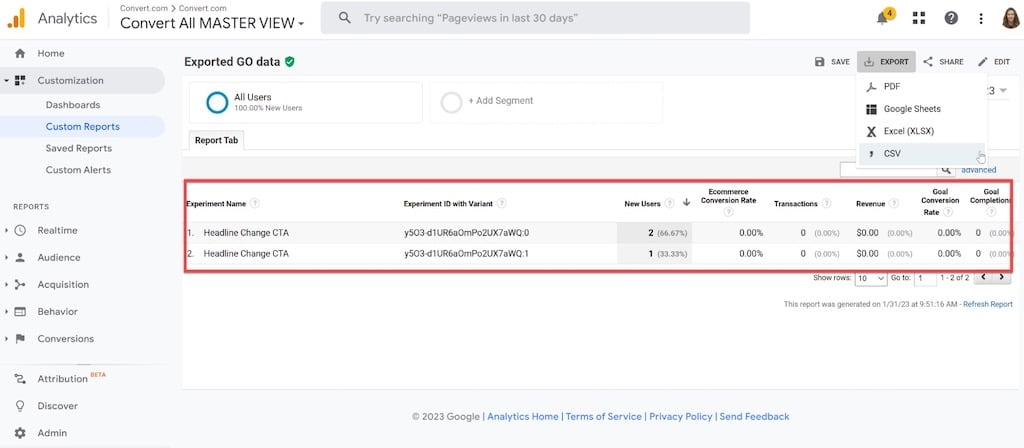
All that’s left to do is add these dimensions, metrics, and filters to your newly created custom report:
After selecting your custom report, you can export the data from it in various formats by clicking the export option.
The custom reports panel allows you to add up to five dimensions, as well as add or delete metrics based on your needs.
Option 4: Free Google Analytics Add-on for Google Sheets
The free GA add-on in Google Sheets can also be used to export your GO data.
Let’s show you how.
Start by creating a new Google Sheet, into which you will import all the data from your CRO tests.
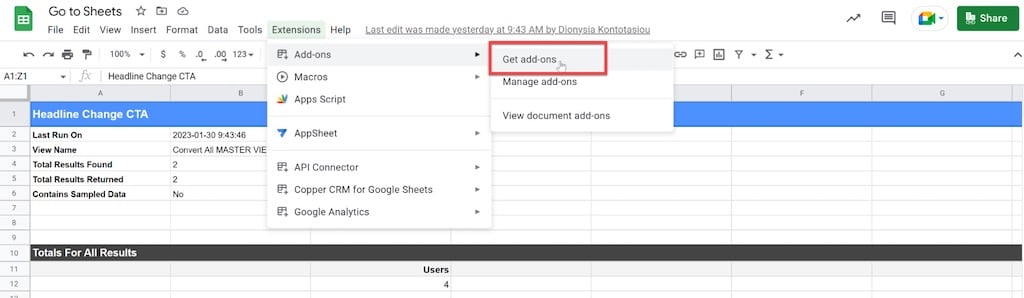
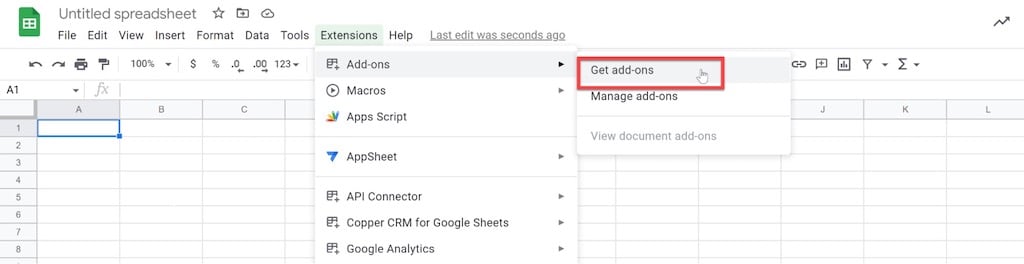
Check that Google Sheets has the GA Add-on installed before you begin the import. If you don’t have it, installing it is simple; just go to Extensions, choose “Get add-ons” from the Add-ons drop-down menu, search for it online, or go to this page.
Once it’s installed, create a report:
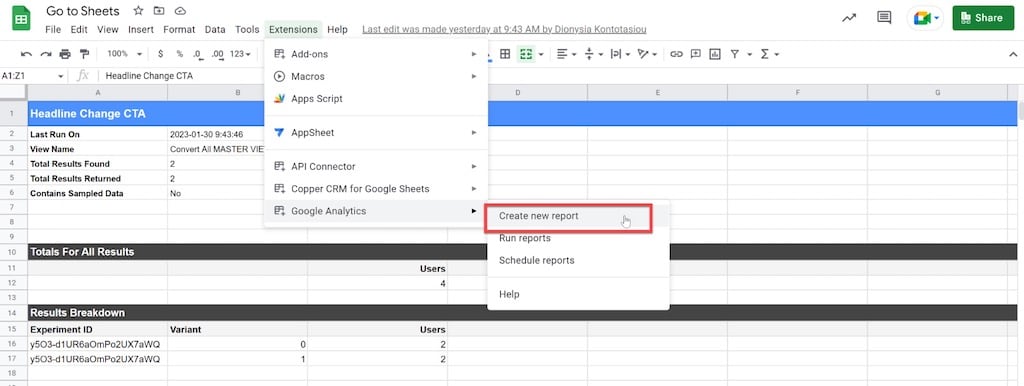
A modal window will appear on the right side of the screen. This is where you name your report, select the account, property, or view from which you want to obtain your data, and then select the metrics and dimensions you want.
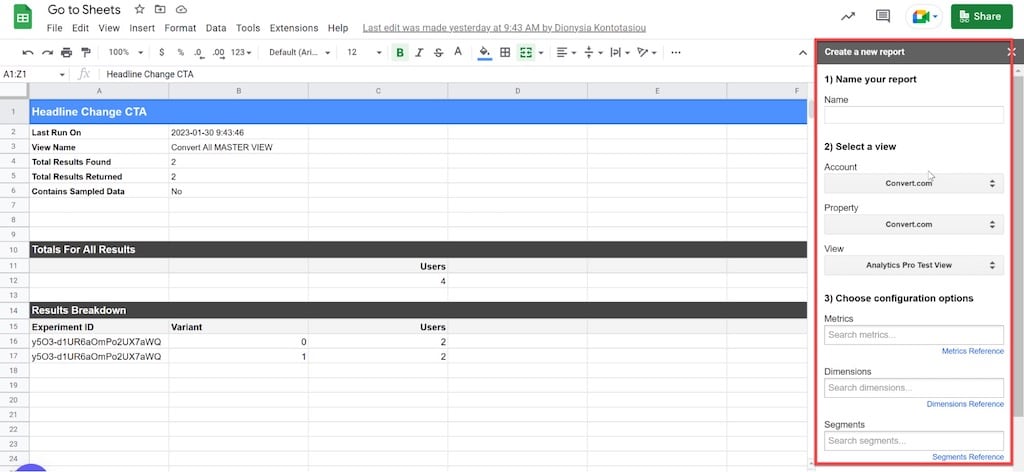
Name the report according to your testing use case.
Choose the appropriate account, property, and view of the GA account that is linked to your GO CRO test data.
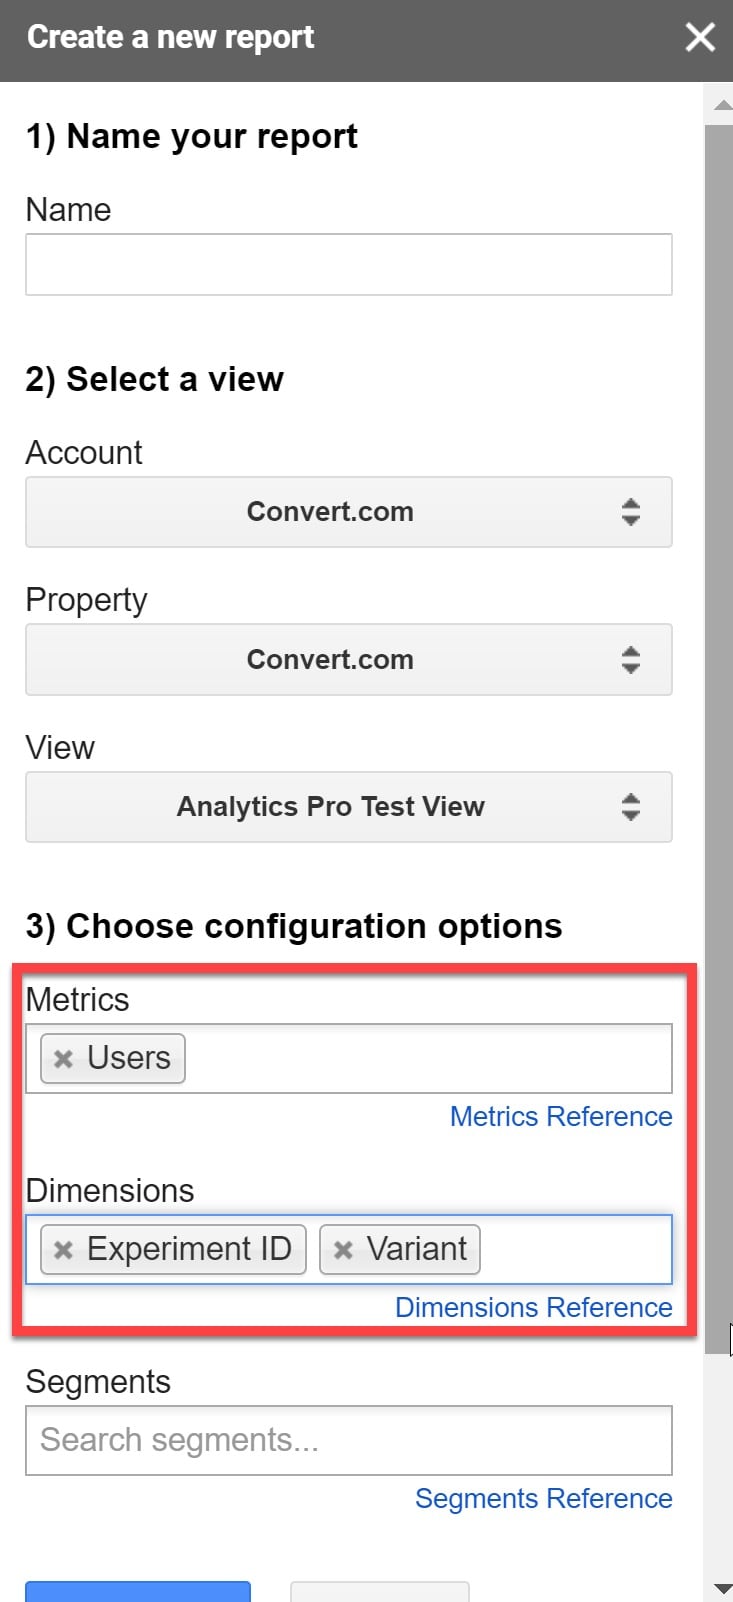
The next step is to select your metrics.
For example, I’m mostly interested in the conversion rate of my CRO experiments, so I search for “Goal Conversion Rate”. If your GO experiment has multiple objectives, you can choose a single goal, such as “goal 3”.
The next step is to set up your dimensions.
“ExperimentID” and “Variant” are the two dimensions you need.
ExperimentIDs originate from GO, and they allow you to focus your GA Sheets report on just your experiment. You may view data from your GO experiment for both the “control” and the “variant” in the “variant” dimension.
Finally, click on Create Report:
You should now have an empty report template with the parameters you chose.
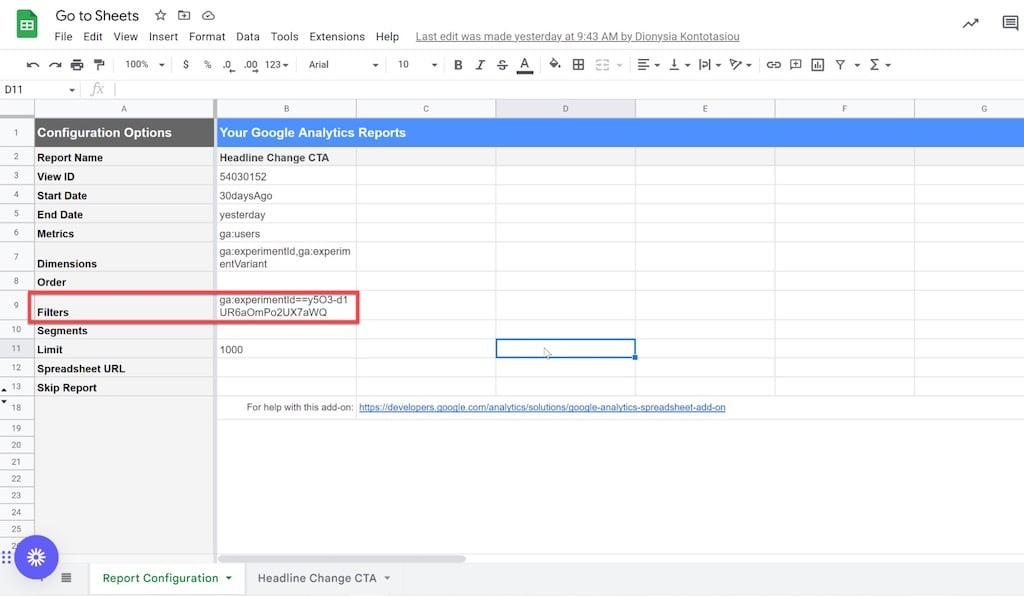
In order to narrow your report down to only one experiment, you’ll need to find the ID for the particular test in your GO account.
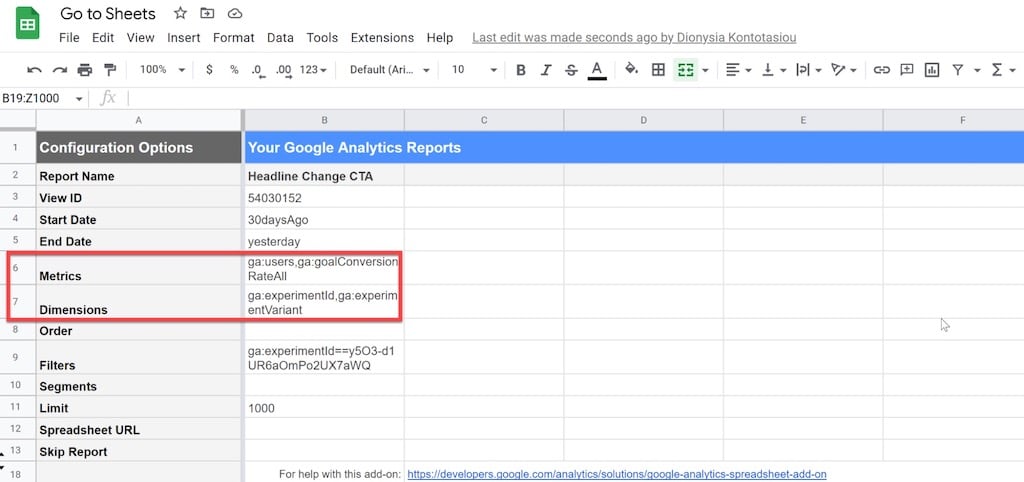
Now, let’s return to your report template in Google Sheets.
In the Filters cell, type the following to narrow the filter to just your experiment:
ga:experimentId==YOUR EXPERIMENT ID FROM OPTIMIZEThis will restrict your report to only displaying data for the specified experiment ID.
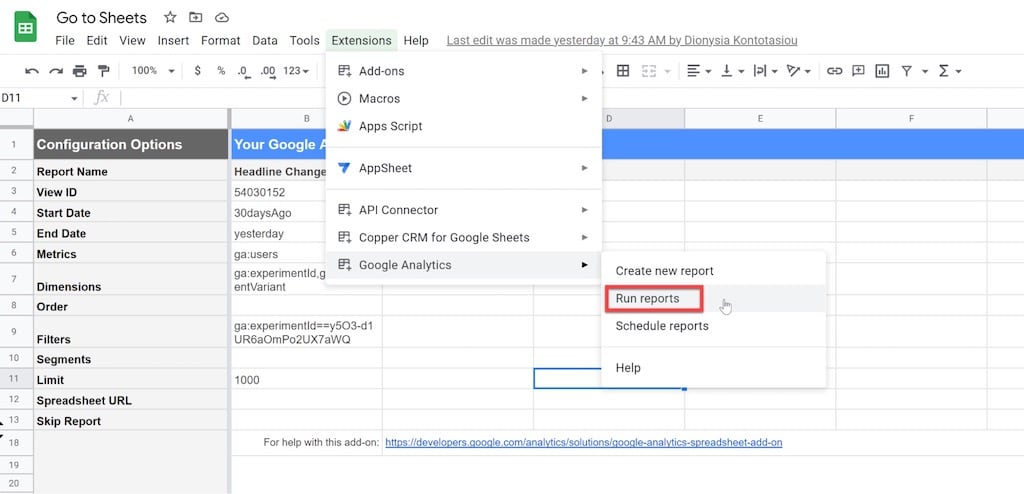
You can now run your report by clicking “Run Reports” in the Google Analytics add-on menu bar.
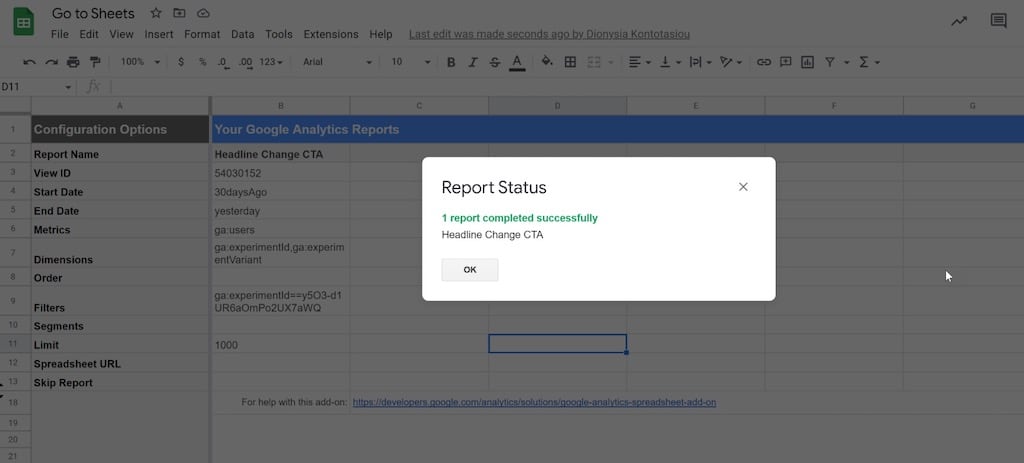
When everything goes smoothly, you’ll see “1 report completed successfully”.
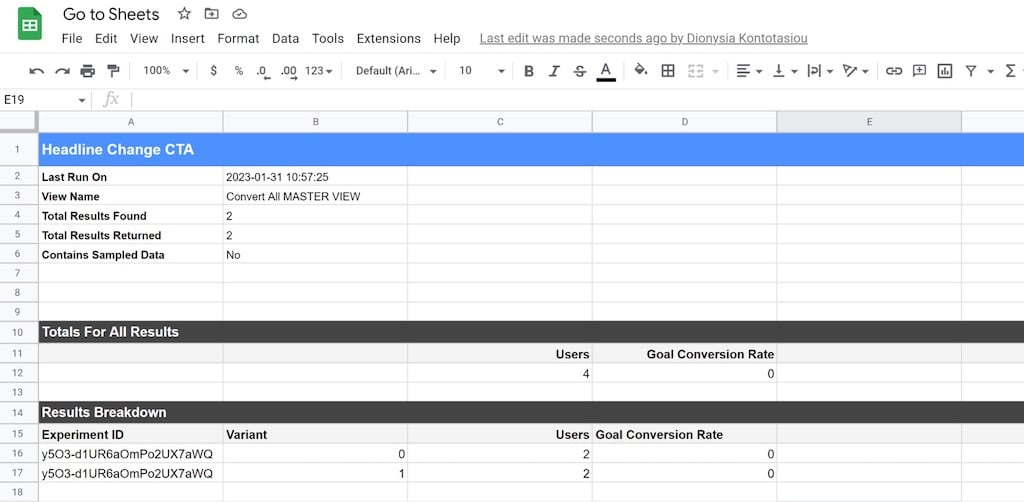
The sheet should now have a new tab with your GO data.
Option 5: Paid Add-ons for Google Sheets
Similar to pulling data from Optimize into Google Sheets using the free GA add-on, a paid third-party add-on like Supermetrics or Two Minutes Report can be used instead.
The first step is to add the third-party add-on to Google Sheets. Let’s start with Supermetrics.
Open Google Sheets → Extensions → Get add-ons and search for either Supermetrics or Two Minute Reports:
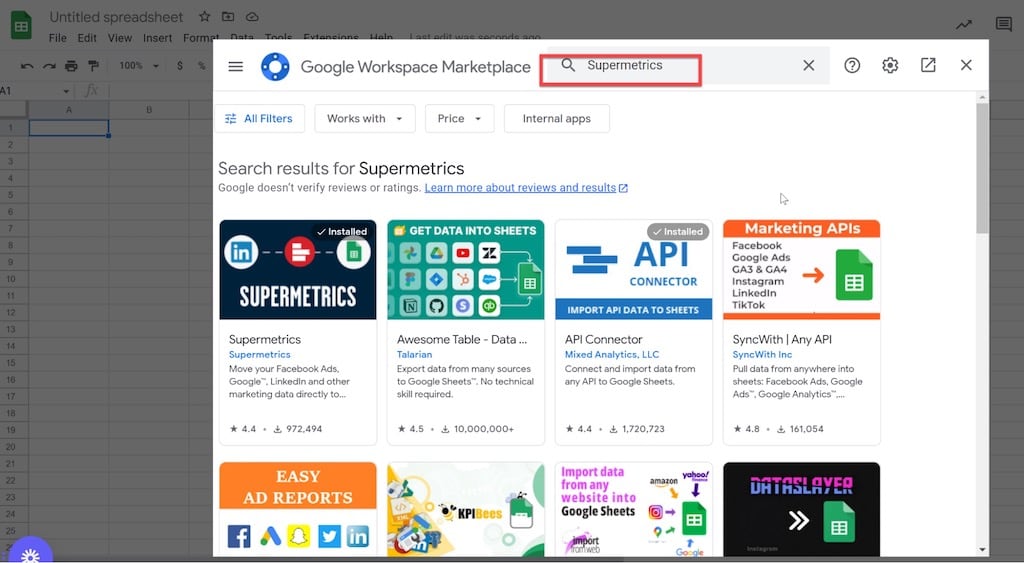
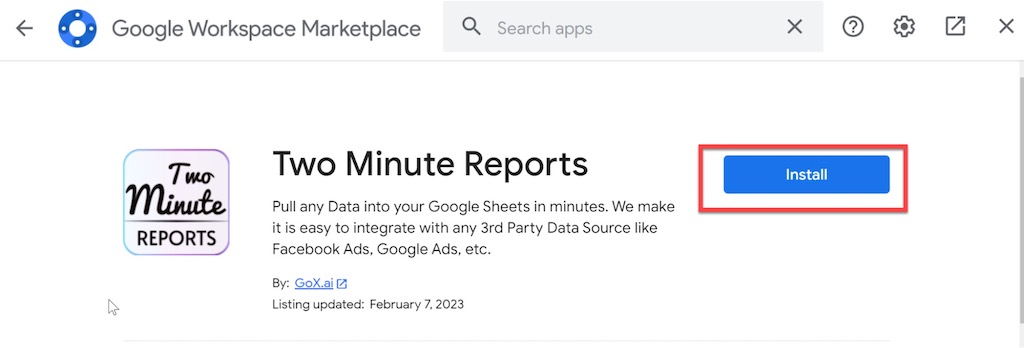
Click to install the add-on:
Upon installation, you will see it on the add-ons list in the Extensions menu:
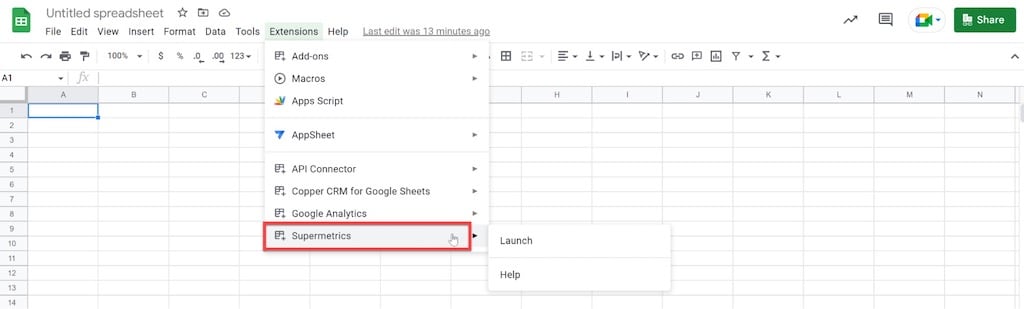
Launch the Supermetrics sidebar by clicking on Add-ons → Supermetrics → Launch. By using the sidebar, you can control what data is pulled into Google Sheets:
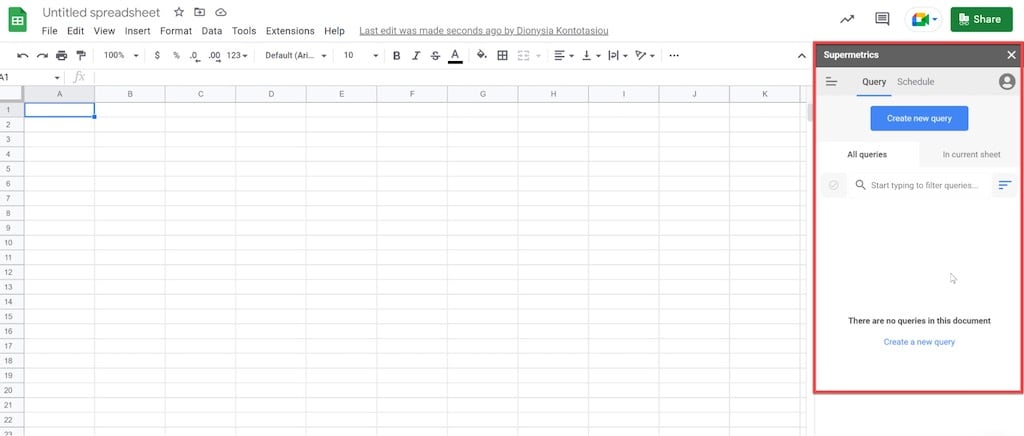
Select “create new query ”. As a data source, select Google Analytics, and as a view, select the GA view or property you want data from (this must be the GA property linked to your GO data).
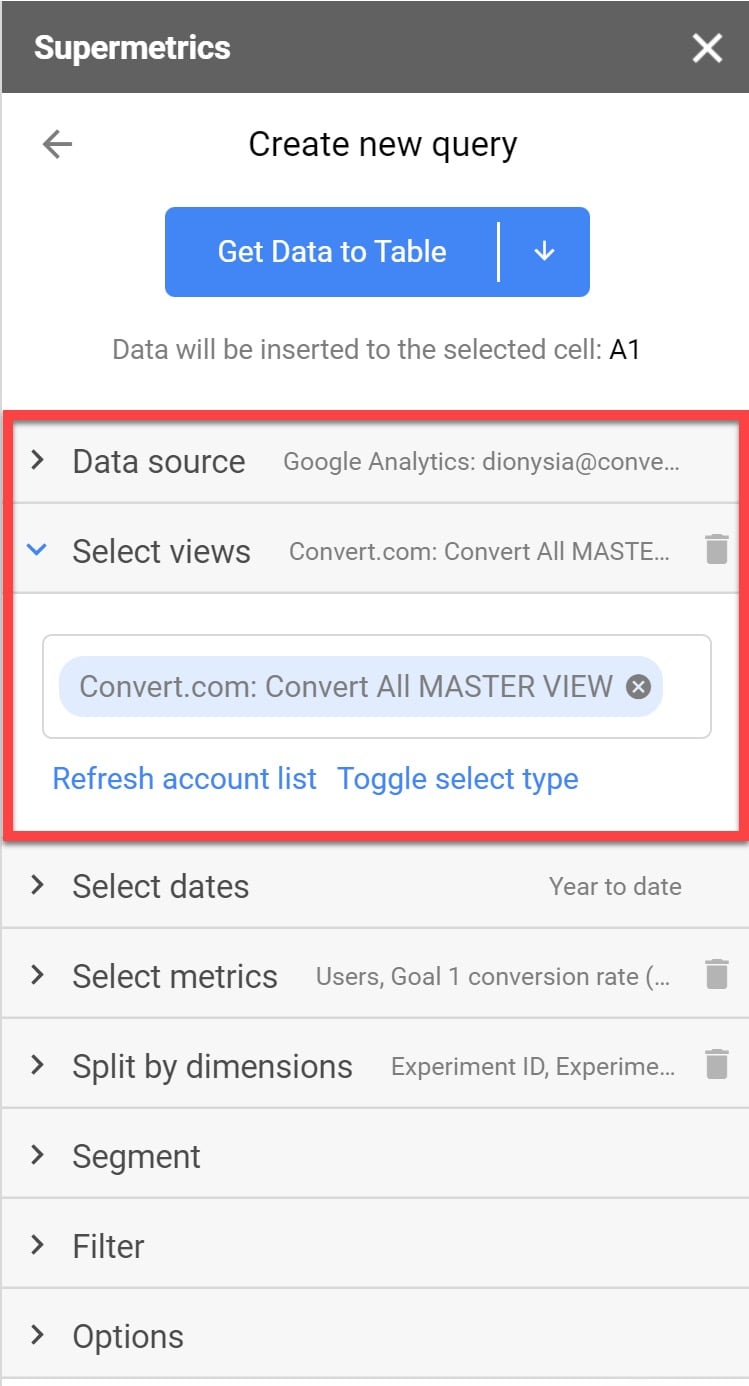
Once that is done, run the queries you want using the correct metrics and dimensions. Your report can include any metrics you like, such as users, goal conversion rates, bounce rates, etc.
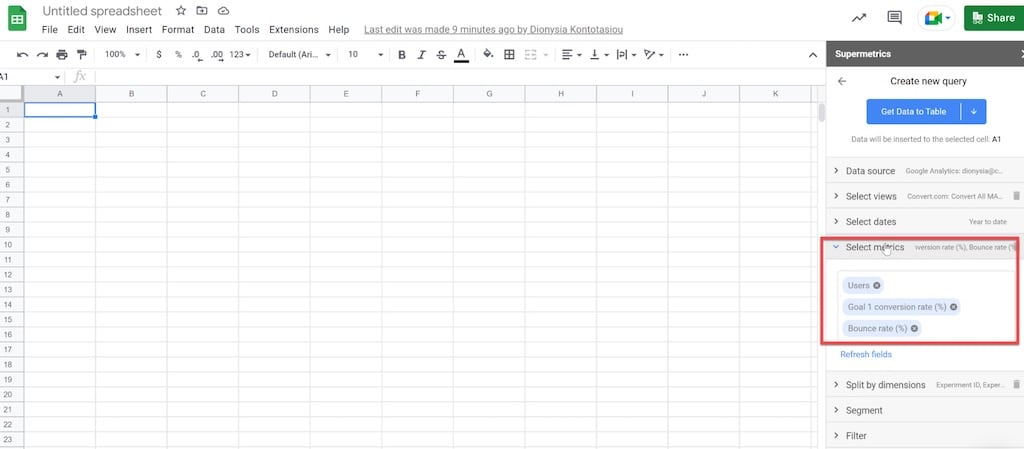
You must choose the Experiment ID and Experiment Variant associated with your GO tests as dimensions.
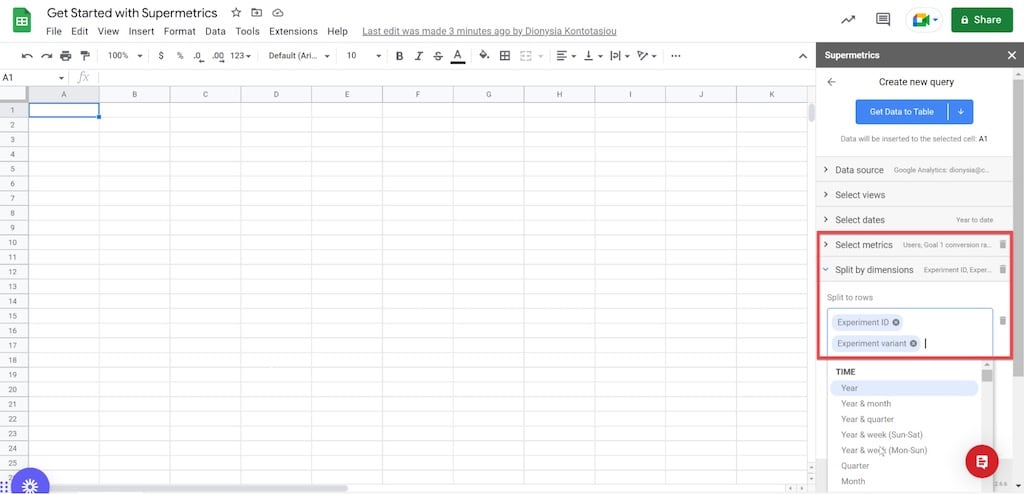
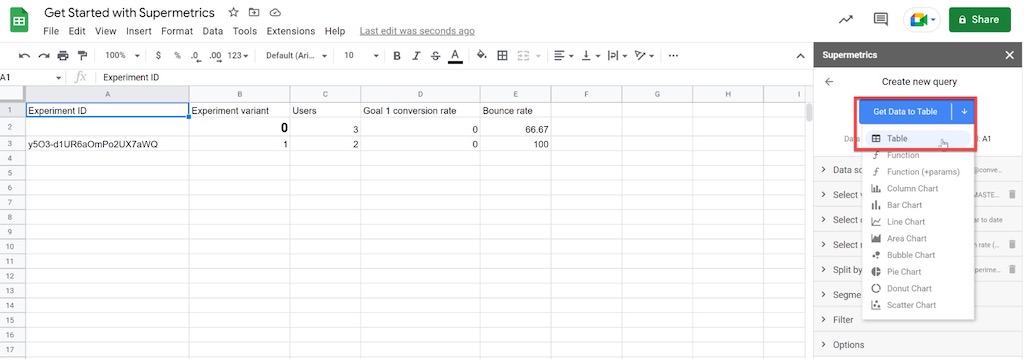
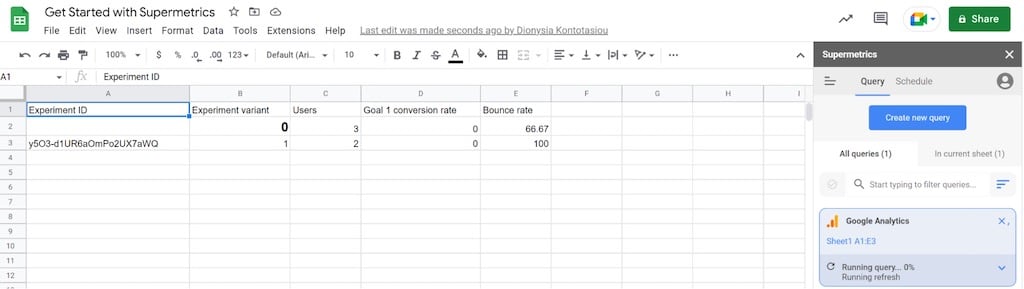
Once you have built your query, click to get the data into a table:
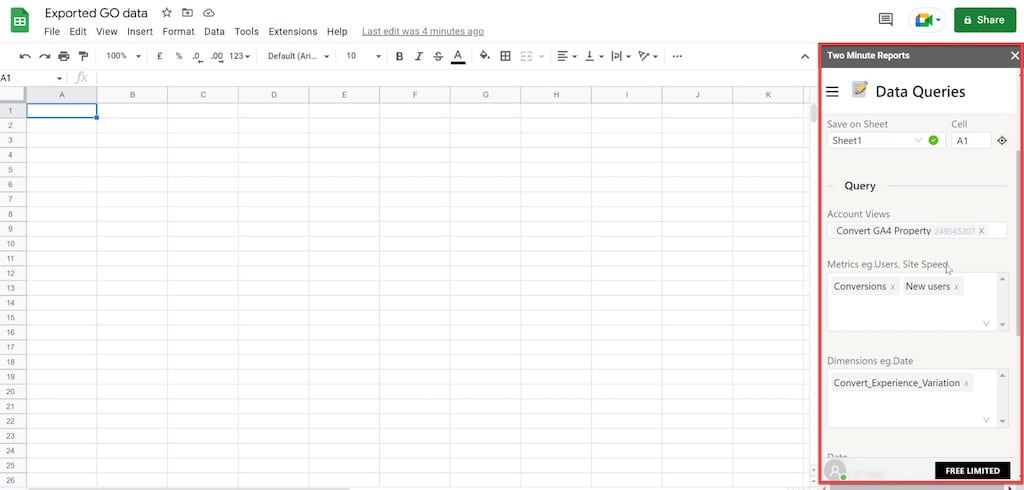
The same process can be followed to connect Two Minute Reports to your Google Sheets and pull your GO data:
Option 6: Google Analytics API
Exporting your GO data is also possible through the GA Reporting API.
The main benefit of using the GA Reporting API is that it allows you to connect applications to GA that might not have direct integration possibilities.
There is only one drawback: it is slightly more difficult.
Installing the API code and connecting it to your business apps would essentially require the assistance of your tech team. The type of application and the base programming language you are going to use also affect the appropriate syntax for using the APIs and exporting raw data.
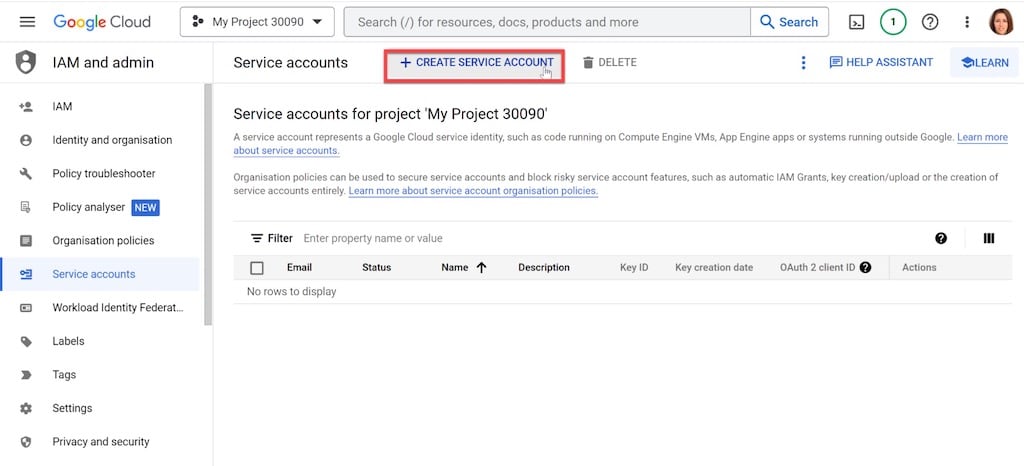
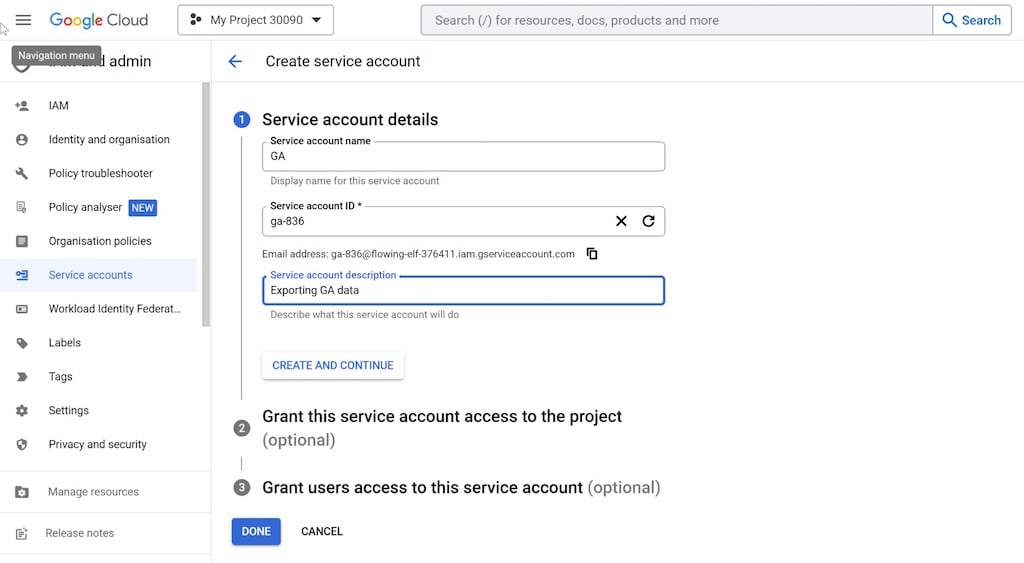
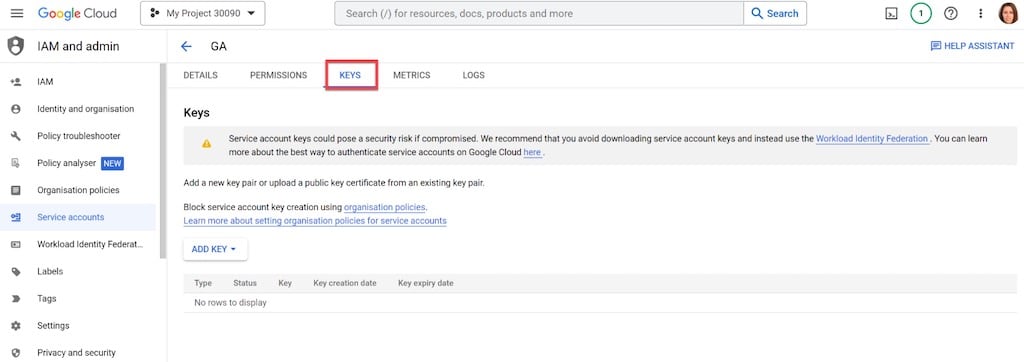
All programming languages, however, require a Google Cloud project, service account, and API keys, which can be created as follows:
Once you have all that, follow any of the tutorials listed below to connect to the GA Reporting API and retrieve your GO information:
Option 7: Databox Query Builder
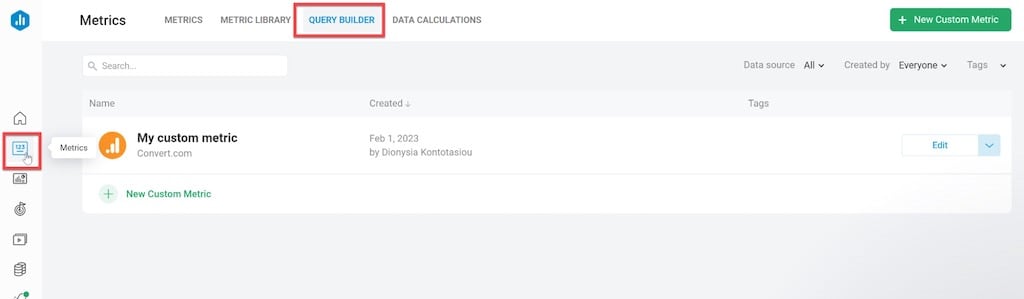
GO data can also be retrieved and exported via the Databox Query Builder (note: you must be on a Databox plan.
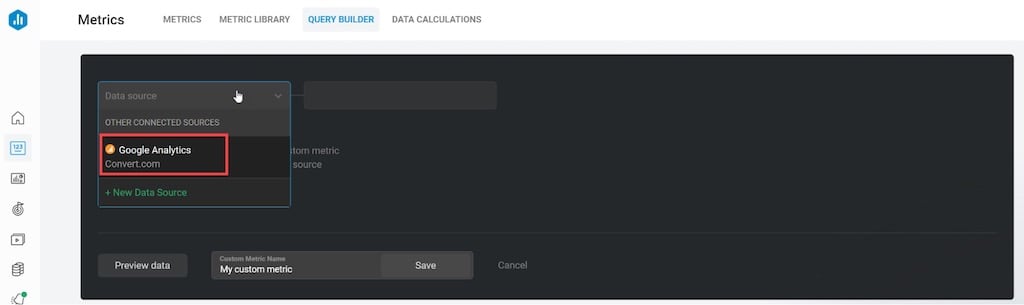
In Databox, go to Metrics → Query Builder:
Select GA as the data source for a new custom metric:
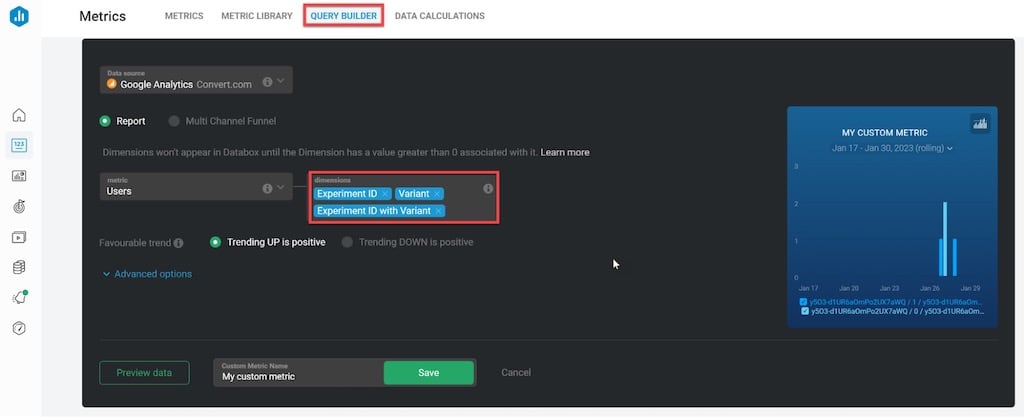
Then select your metrics and dimensions:
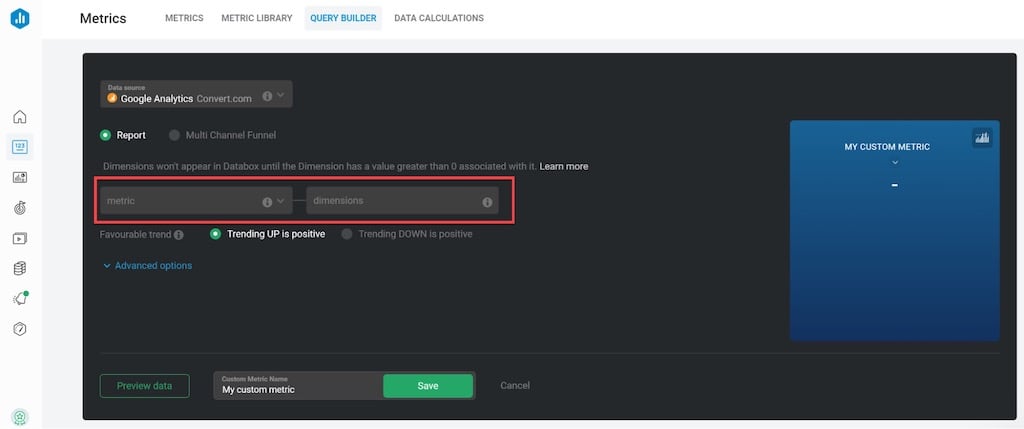
To access your GO data, experiment IDs or variants need to be added as dimensions.
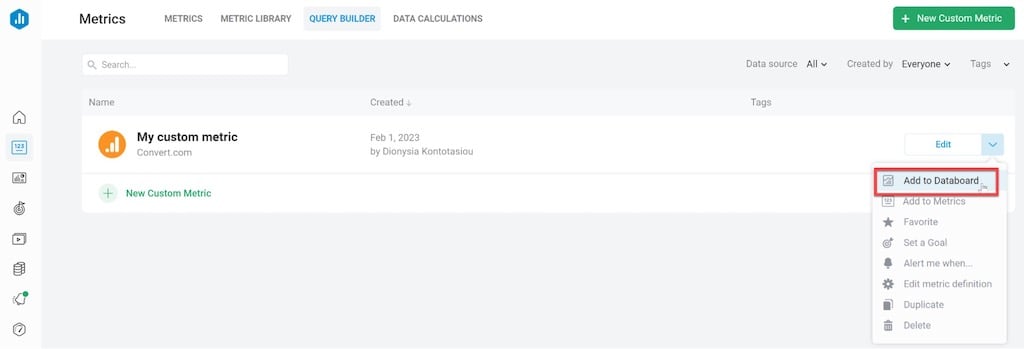
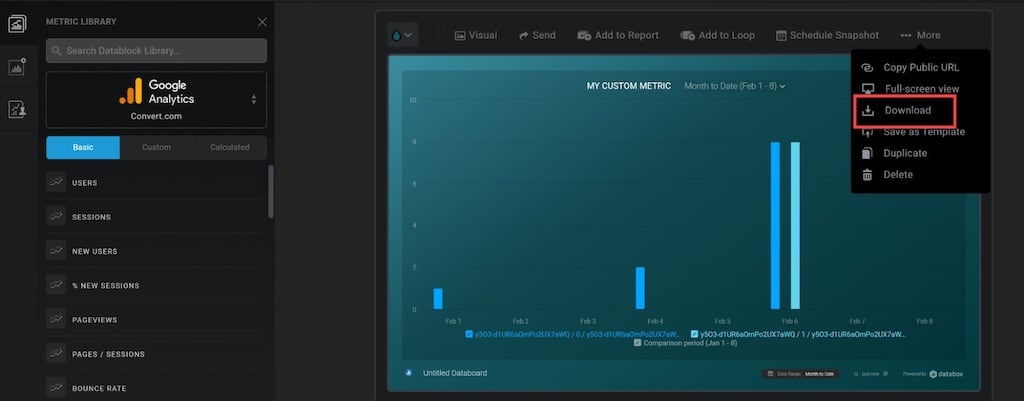
You can preview your GO data once you have set up the custom metric:
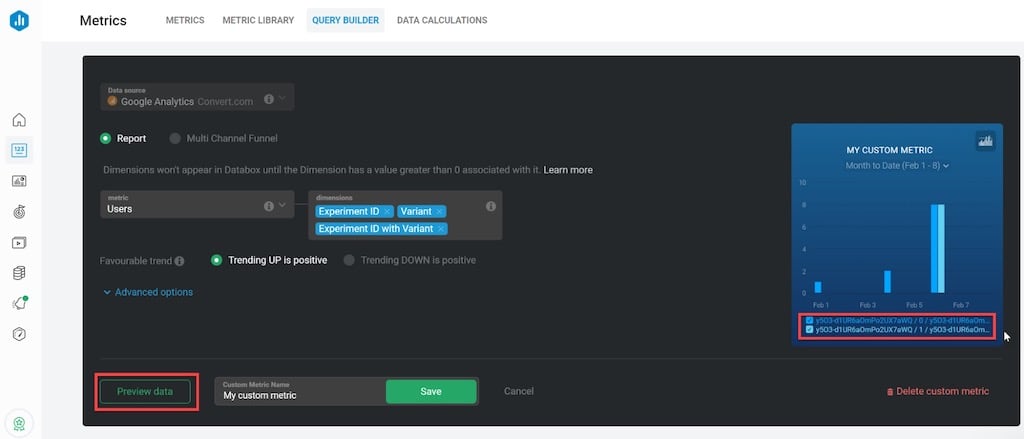
And add it to your Databoard:
Or download it:
Option 8: BigQuery Export
You can use Google BigQuery to export raw data using its built-in interface if your business is one of the few that uses Google Analytics 360, the enterprise version of GA. When you export data using BigQuery, there are no data restrictions. However, since the tool organizes data using SQL, it will require some technical know-how use.
With BigQuery, you can export raw data in one of two ways:
- Daily data export, where BigQuery creates three files with data from the current day and one file with all of the prior day’s data from GA.
- Continuous exports every 10 to 15 minutes.
Although it is the simplest method, it is also the most expensive approach to exporting raw data from GA. You must be an active paying customer to use Google Analytics 360 and BigQuery.
Option 9: Amazon Appflow
Last but not least, if you are an AWS user, check out this tutorial. It tells you everything you need to know about extracting GA data with Amazon AppFlow and storing it in Amazon S3, so you can query it with Athena.

Which Option Should You Pick?
With nine different ways to move your data, you are well-equipped to make the transition to a Google Optimize alternative.
While all of them will allow you to export your data, Option 1 stands out as a full migration solution that not only exports but also imports data into the Convert app.
Remember, a successful data migration process is key to maintaining the integrity of your testing insights and maximizing the impact of your experimentation efforts.


Written By
Dionysia Kontotasiou

Edited By
Carmen Apostu
