Input vs Output Metrics in Experimentation: How to Choose What to Measure
The metrics you define and track for your experimentation program are incredibly important.
What you measure determines your focus. They say “you can’t manage what you don’t measure.”
And while that’s entirely true (you can certainly lose weight even if you don’t look at a scale), it is directionally and practically true (it’s much easier to lose weight if you look at a scale).
I’ve spent a ton of time thinking about what metrics matter in experimentation.
More importantly, I’ve spent a lot of time thinking about both input metrics and output metrics.
What’s the Difference Between Input and Output Metrics?
Input metrics are leading indicators, things you can directly control. Typically, they track effort, resource allocation, and operational efficiency.
The idea of input metrics is that they correlate to output metrics.
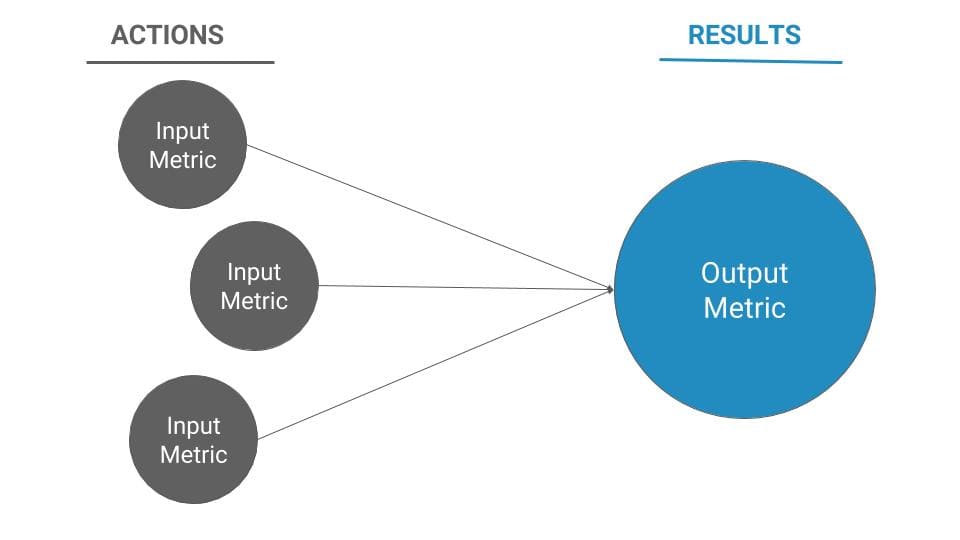
While you can’t very accurately predict, specifically, what your aggregate conversion rate will be, you can easily control how many experiments you’re running, how efficient you are at pushing wins to production, and to an extent, what your win rate and average win size are.
These things can and should map to your output metrics, which are typically numerical business metrics that stakeholders care about. They’re the numbers that show whether or not all the effort you’re putting into experimentation is actually paying off from an ROI perspective.
Because output metrics focus on business outcomes, I’ll walk through those first – the reason being that your output metrics should determine your input metrics.
Stated simply, your output metrics are what matters to the business, and your input metrics are the levers you can control to get to those outcomes.
Experimentation Output Metrics
Output metrics are what you show your boss. They tie back to the value of your experimentation program and show that, on the whole, you’re producing positive ROI.
Realistically, an experimentation output metric can be anything quantitative that you can measure. In most cases, this is a discrete or binary metric like conversion rate, but sometimes it’s a continuous metric like revenue per visitor.
In all cases, you want to map your output metric that most represents value to your business.
The best way to split experimentation metrics is into two categories: micro-conversions and macro-conversions (also known as primary and secondary metrics).
Micro-conversions vs Macro-conversions (& Monitoring Metrics)
The common advice in the A/B testing space is to optimize for macro-conversions.
Macro-conversions, while defined by you and your business, are those that lie closest to the money. In e-commerce, this is the purchase or the revenue per visitor. In B2B, this could be high quality lead conversions or perhaps product signups for a freemium software.
Whatever the case, you can map micro-conversions directly to revenue, and thus, ROI in these experiments is easy to measure and justify effort.
Micro-conversions are those actions that lead up to the macro-conversion and tend to correlate strongly with macro-conversion completions.
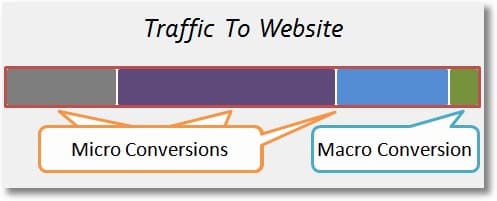
In e-commerce, micro-conversions could be add-to-carts, banner clicks, or even email list signups. In B2B, they might be clicks to the pricing page, CTA clicks, or email list signups.
There’s also monitoring metrics or guardrail metrics. These are quality indicators that you may not aim at improving, but aim at not harming. So if an experiment increases conversion rate, but also increases product return or refund rate, you may not push that experiment to production.
There’s no universal and objective split between the two categories, though there are some obvious fault lines. Namely, does the conversion directly lead to revenue for your business?
I’ll walk through 18 output metrics here, splitting them into macro and micro-conversions. At the end, we’ll discuss how to choose the right output goals for your business.
Macro-conversions
Conversion rate metrics (of any type)
Conversion rate is the most common output metric, but it can mean many things for many different types of business.
At a fundamental level, it just means you’re trying to increase the proportion of those who view an experience and then complete a desired action after viewing that experience.
1. Lead conversion rate
One of the most common conversion rate types is lead conversion rate.
This is the proportion of visitors to your website that sign up to become a lead. The definition of a “lead” of course depends on your business. In some cases, it’s someone who signs up to request a demo.
Sometimes, businesses further drill down and only count “qualified” leads, which is based on data enrichment or the filtering of various dimensions to determine whether or not someone is a good fit for the product.
Other businesses will count marketing qualified leads, such as those visitors who sign up for a webinar or download a whitepaper.
2. Product signups or purchases
Product signups are clear macro-conversions. If you sell physical goods, this is someone purchasing them. If you’re a freemium SaaS company, this is someone entering your product for the first time.
It’s hard to imagine a marketing experimentation program that doesn’t track this as a core experiment KPI.
3. Activation rate
Getting into product experimentation, one of the first things to keep in mind for a product-led growth company is the activation rate.
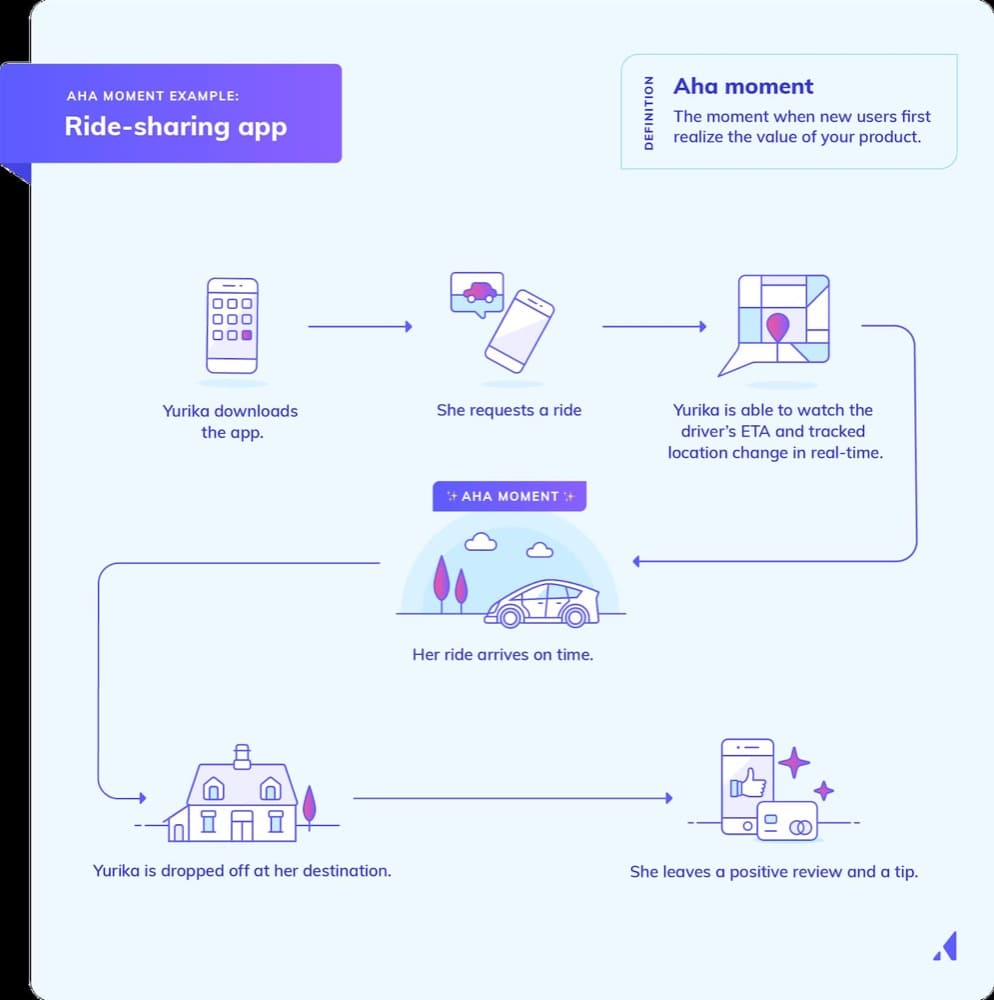
After someone signs up, what’s the first action in the product that is meaningful and shows the user is engaged?
Some companies have this mapped out to a specific action or number of actions (Facebook had the famous 7 friends in 7 days rule).
This moment is typically referred to as the “aha moment,” the moment or action that causes the user to understand the value of the product. This moment is typically discovered through both qualitative feedback and the quantitative ability to correlate this action with longer retention or better monetization rates.
4. Monetization rate
Like activation rate, monetization rate is commonly used in product-led growth companies with many freemium users, or at least several escalating product tiers.
In freemium models, this metric is discrete – does the free user pass the barrier to become a paid user or not? In other models, this metric may be continuous – for example, if a company charges based on usage like AWS, it’s not as simple as delineating between “paid” and “non-paid” accounts.
5. Email list signups
Most businesses at this point realize the value of email marketing and building a solid email list. Especially for content marketers and bloggers, the most interesting macro-conversion may be converting readers to email subscribers.
Painting this with a dollar value will require some analysis work, but if you have enough historical data, you can typically assign an average revenue value to a given email you collect.
6. Email activation rate
Email activation rate is an underrated marketing metric. Just because someone signs up for your email list doesn’t mean they’re engaged or valuable.
This is like the “high fit lead” version of email marketing.
You can define “activation” here how you’d like, but many will include something like “opened one of the first three emails” or some other way to show the person is actually reading and opening your emails.
Customer value metrics
Customer value metrics are typically continuous variables, which makes them a little more difficult to use as experiment metrics. But they’re almost always the closest approximation to real business value, and they can act as great lagging indicators of your work.
7. Revenue per visitor
Revenue per visitor is one of the best composite metrics for ecommerce. Not everyone will purchase something, but some will. And some of those who purchase will purchase a large amount of product.
Revenue per visitor places an average value on each website visitor, so you’re including both the purchase size as well as the number of customers who purchase in this equation.
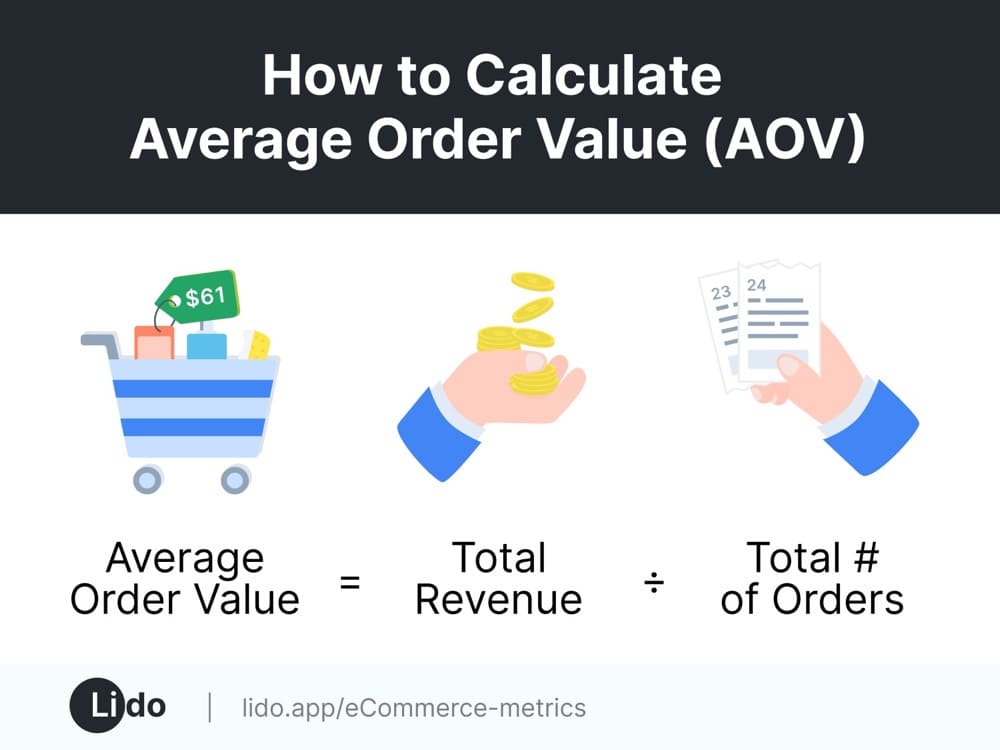
8. Average order value
Average order value calculates, among those who have purchased, what the average purchase size is. This is relevant, again, to e-commerce websites where you can buy directly on site. It could also be ASP (average selling price) in B2B deals.
9. Number of purchases
A sort of retention metric for e-commerce, you can track the number of purchases in a given time period (month, quarter, year).
This tracks repeat purchases and is indicative of both website traits as well as marketing channels to drive more repeat buyers (usually email marketing and paid advertising). This is a holistic metric that seeks not only to optimize for the sale, but also the second and third sale.
10. Retention
In SaaS products, customer retention is key for growth. You can drive thousands of users to sign up, but if they don’t pay and keep paying, your business will leak revenue over time.
While many things impact retention beyond the product itself, experiments can also help move the needle on retention. Tracking retention as an experiment KPI becomes somewhat difficult for many businesses, however, as it’s a long feedback cycle.
11. Customer lifetime value
Finally, the mystical top of the pyramid when it comes to composite metrics: customer lifetime value.
This takes into account all preceding metrics like monetization or average selling price, retention (how long someone stays a paying customer), and also average conversion rates, and then builds a composite metric using customer lifetime value formulas to estimate how much, on average, a customer is worth to your business.
This is obviously a very difficult thing to measure on a per experiment basis, but as a business KPI, it’s important to know.
This lets you figure out ways to increase product value as well as shows how feasible certain marketing channels and ad campaigns could be.
Micro-conversions
1. Click through rates (of many types)
Click through rate is the main type of micro-conversion. Whether that’s from the ad to the landing page or from the landing page to the request a demo page.
In e-commerce, this is often tracked as click-through rate to the product page, or perhaps even an ‘add-to-cart’ action or viewing the shopping cart. This could also be something like email open rates or email click-through rates for email marketers. Your email marketing tool should give you this information easily as well as the ability to A/B test different versions.
Of course, you have to click from one location to get to the next, so click-through-rate should correlate with higher purchase or conversion volume.
But if you solely track click-through-rate as your experiment KPI, you can often game this through copy or UX trickery.
CTR is terrible for optimizing hotel bookings (e.g. EMK with subject “FREE BEER” will improve CTR, but probably reduce sales once customers figure out there is no beer on your site, certainly not free beer).
Andrew Chen calls this the conservation of intent and posits it’s one reason why A/B test results don’t translate to the top line.
2. Link clicks
Link clicks is just what it sounds like – the number of people who click a given link. This is another click-through-rate metric, but for certain businesses (i.e. affiliate), clicking an outbound link is an important indicator of intent.
I always set up link click tracking on websites I work with, mostly because it can indicate website user behavior and optimization opportunities.
Some experiments, also, are set up with the intent of shifting the direction of user behavior (sometimes mapping to a macro-conversion, but sometimes just seeing if they can drive more clicks to a new module).
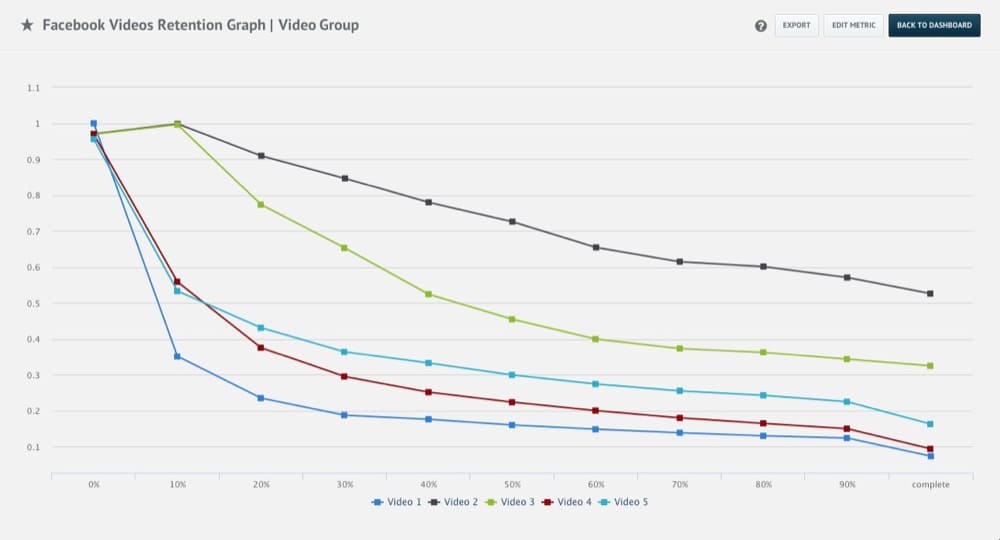
3. Video plays
If you have a video on a landing page, tracking how many people actually view the video or play it is important.
However, I’ve seen experiments where just adding a video increases conversions without actually having many visitors view the video itself. So if you’re tracking this, I’d still recommend mapping your experiments towards the macro-conversion on the page.
4. Video completions
There’s how many people played the video, and how far people watch the video. Video completions or video completion rate shows you how far the average person gets through the video.
Again, this can be important, especially on educational pages, but I’d still advise you to choose a more appropriate business KPI like lead conversion rate. You can still track video completions, and you probably should, but just because someone watches a whole video doesn’t necessarily mean they’re more likely to convert.
5. Product tour views
For many B2B companies who don’t have a freemium or free trial plan, a limited interactive product tour is a great way to show visitors what the product actually looks and feels like.
Here’s an example of Pendo’s product tour:
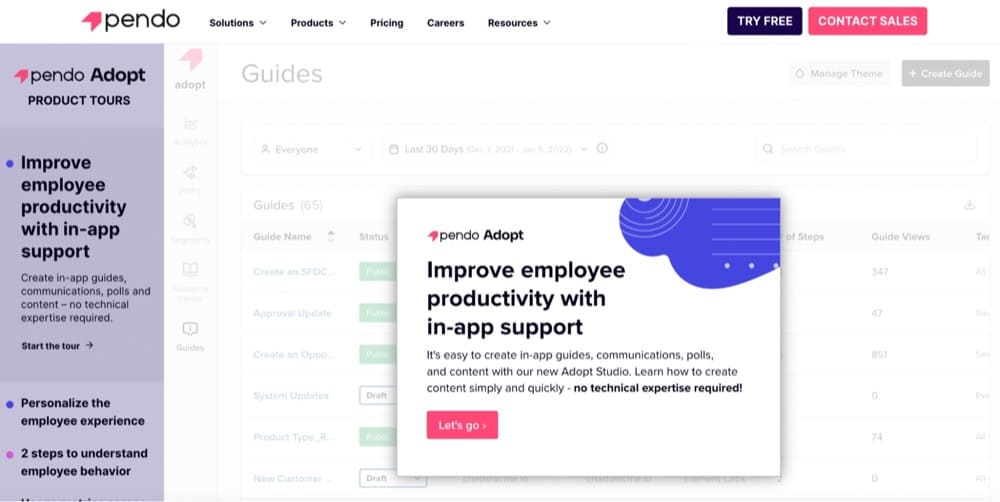
As a KPI, you should treat this like video views or any sort of promotional module views. While they can and often do correlate with a more business-centric KPI like conversion rate, they don’t always. So track this stuff, but also measure your macro-conversion as the primary experiment KPI.
6. Product tour completion rate
Again, there are those who view a product tour and bounce right away, and those visitors are different than those who view a product tour and complete it. Perhaps there is a correlation between product tour completion rates and conversion rate, but there may also not be one.
If you’re treating the product tour like a product in itself, then of course it’s important to see how many people are completing it. This is a good UX metric for the product tour.
7. Pricing page views
Most B2B buyers will visit the pricing page before purchasing, though it matters when in the customer journey they visit this page. So many marketers will track click-through-rate to the pricing page as a micro-conversion.
It’s sort of like the add-to-cart version that exists in e-commerce optimization.
Experimentation Input Metrics
Input metrics in your experimentation program are defined at the program level. They don’t directly track to revenue, but they are actions that correlate with improvements in your output metrics.
In most cases, your experimentation input metrics will either attempt to increase the return of your experiments or decrease the cost of running experiments (through increased efficiency).
I’ll run through 6 experimentation input metrics here.
1. Experiment velocity
Experiment velocity measures how many experiments you launch in a given time period.
Generally, the three input metrics that form the basis of your ROI are how many experiments you run, what percentage of them are winners, and what the average win is.
Simply put, running more experiments (or more variants per experiment) increases the chance that you’ll get a winner (provided they are good quality experiments).
Increasing experiment velocity is also great as a forcing function; it helps you see where development and production bottlenecks occur and where you need additional resources.
2. Conclusive rate
To me, there’s nothing more disheartening than a string of inconclusive experiments. I’d rather see a conclusive loss sometimes than an inconclusive test, because at least then I can insinuate that what I’m testing matters to the user experience.
Therefore, some people are starting to track conclusive rates – the number of conclusive experiments out of all the experiments you run.
If your program is at an earlier stage or you seem to be running a lot of inconclusive experiments with little learning, this could be a good metric to force you out of that rut.
3. Win rate
We all want to run winning experiments. Part of experimentation is accepting that they won’t all be winners (if they were, you need to question how much low hanging fruit you’re tackling versus trying new innovative things).
Win rate shows you, of the experiments you run, how many of them are winners?
If you increase the number of experiments and maintain your win rate, your ROI increases (assuming marginal costs to running more experiments). If you maintain your experiment velocity but increase your win rate, your ROI also increases.
This is a key lever in improving experiment ROI.
4. Average uplift per win
Finally, of the winning experiments you run, what is the average uplift by which they win?
This is very hard to control for, because if we could predict the magnitude of an experiment, well, we wouldn’t need to run it.
However, it’s good to track, because, like experiment velocity and win rate, it’s a clear leading indicator of the value of your experimentation program.
Additionally, incentivizing bigger wins can often lead to marketers and product marketers thinking outside the box and trying out bigger, more innovative experiments.
5. Development time
I break down my experiment process into distinct steps.
Typically, the workflow looks like this:
Experiment idea > experiment document > wireframe > design > development > QA > run test > analyze > document > push to production
I set estimated due dates for each step at the planning stage, and then I calculate the delta between the expected due date and the actual. If there’s too big of a difference, this shows me we may have a process bottleneck.
Most often, this is going to come at the design or development stage.
If you can improve these stages, you can increase your experiment throughput, which is one of the key input KPIs we look at.
6. Time to production
Similar to development time, time to production measures a stage of the experiment process: how long it takes to go from analyzing a winning experiment to implementing it live in product or on your website.
This stage is often underrated. Experimenters will celebrate a win and then move onto the next one, but how fast you get something implemented is important. For one, it reduces regret – the time you’re operating with a suboptimal variant.
Second, improving at this stage allows you to focus more and more developer time into setting up subsequent experiments.
Composition Metrics and the Overall Evaluation Criterion
There’s a concept in experimentation known as the overall evaluation criterion. One might also call it a North Star metric.
This is a metric that takes into account guardrail metrics (i.e. metrics to watch and account for that may imply harm or user experience losses). Guardrail metrics could include things like bounce rate, exit rate, or even attitudinal scores like NPS or CSAT.
The overall evaluation also sometimes combines a few different output metrics into one single success metric.
These metrics are almost never short term indicators like clicks, but rather track to some macro-business goal.
Ronny Kohavi gave these examples, “units purchased, revenue, profit, expected lifetime value, or some weighted combination of these.”
While creating an overall evaluation criterion is desirable, it typically takes a lot of data engineering work, especially if your business model is a marketplace or something less straightforward than e-commerce (although even in this case, it’s difficult to track customer lifetime value on a per experiment basis).
The broader point, however, is this: the closer you can get to forming one comprehensive success indicator – one that takes into account long term business value as well as accounting for guardrail metrics – the clearer your experiment program and its objectives will be.
How to Choose Experimentation Goals and KPIs
Okay, we walked through a dozen or so output metrics and several input metrics.
The question, then, is how you and your business choose what to focus on – because it *is* a choice, and from that choice will flow all kinds of incentives, behaviors, and actions.
The best way I’ve come up with to choose your metrics, goals, and KPIs is to create a goal tree.
Speero has a great example of a goal tree visualization here:
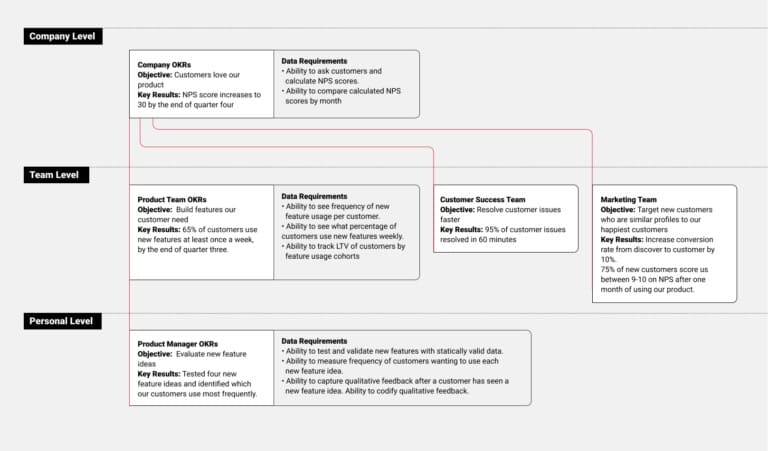
In it, they start with company level goals, which include customer satisfaction metrics. This flows into team level goals, which focus on successful feature development. Then it slows into personal level goals, which focuses on testing and ideating new feature proposals.
I believe all team and personal goals should directly reflect and contribute towards company goals. This is alignment, and when you achieve results that contribute toward company goals, you’ll have a lot more excitement for your program because you’re showing real ROI towards the company mission.
How this will look in your company depends on many factors. The important thing is to go through this exercise and think critically about which goals you choose.
Conclusion
How you define your goals in experimentation affects almost all actions downstream of those goals.
In theory, there are thousands of metrics you could feasibly track on both an output and input level. Choosing the right metrics, not only to track but to gauge the effectiveness of your experiments or your program, is critically important to the success of your program.
So in reality, I believe you should choose to focus on as few metrics as you can. This allows for focus, but it also gives you the time to improve these over the course of months or years.
I like to split my goals into two categories: input and output metrics. Output metrics are what I judge my individual experiments or the results from my experimentation program on. They’re what I report to the team and executives.
Input metrics help me build a more effective program. They’re what I judge my own efforts and those of my team on.
How do you define experimentation metrics for your program? Do you focus on input metrics, or just on outputs and results?


Written By
Alex Birkett
Edited By
Carmen Apostu
