Cost Per Lead vs. Cost Per Acquisition – What You Should Use as Your Performance Metric
Almost every company I interview, whether it’s an agency responsible for their clients’ media spend or they’re running their own paid traffic campaigns, the one metric they always focus on is the Cost Per Lead (CPL).
What doesn’t seem to add up is that no businesses I know use Cost Per Lead as one of their marketing KPIs. On the other hand, every successful business acknowledges that they’re always looking at their Cost Per Acquisition (CPA) across all of their marketing campaigns.
For example, let’s say you’re a SaaS company that runs two different ads to generate demo requests. One ad may generate a lot of demos that may not convert into actual customers while the other may not generate as many demos but most of them convert into actual customers. Would it really be worth the effort to get the Cost Per Lead for your first ad lower? Probably not.
So why are most digital marketers so focused on Cost Per Lead? Before I dive further into the issue, let’s define some terms. Here is how a click turns into a customer if you’re generating leads through search engine marketing or any pay per click advertising:

Now if you’re running an e-commerce website, then this is how your funnel looks:

The difference between the lead funnel and the e-commerce funnel is that the e-commerce funnel “skips” a step. You can track the conversion back to the click directly through your SEM platform (Google Adwords or Bing Ads). More on e-commerce funnels near the end of this article.
First, let’s look at the lead funnel and why it makes sense to put CPL in the back seat and use CPA as your end-all metric.
The CPA for Lead Funnels
For lead funnels, Cost Per Lead (CPL) is the dollar amount in clicks it takes to generate a lead. In your Google Adwords dashboard, they call this the Cost Per Acquisition, which may be confusing. But what they mean by this is that it costs $X in order to “acquire” this lead.
Cost Per Acquisition (CPA) in most other cases, however, is the cost to generate a customer. This is the key event that’s further down your funnel. For example, if your ad and landing page generates 20 leads, only 5 of them may convert into actual paying customers:
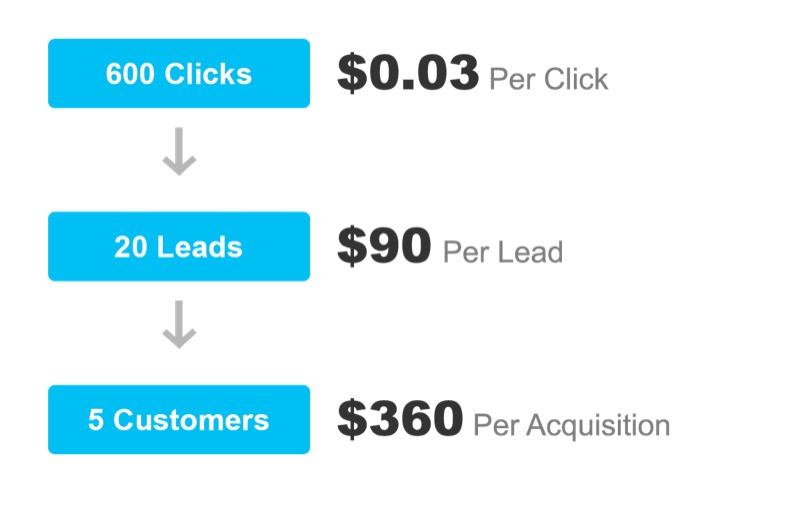
Customers equal revenue for your business, not leads.
If, for example, you’re using Google Adwords, you’re probably focusing on getting your Cost Per Lead down through a number of ways such as seeking low competition and long-tail keywords or increasing your Quality Score. And you should be focusing on this. But if you’re like most marketers I know, your reporting is probably centered around Conversion Rate Optimization (CRO), which is the act of split testing multiple ad variants or content to see which one generates more leads at the same ad spend. In other words, which ad variants give you the lowest Cost Per Lead.
The problem with this thought is not Conversion Rate Optimization in itself but rather CRO is commonly approached with the goal of lowering the CPL, and that’s where everyone stops.
My advice: Don’t stop there.
Instead, take your reporting a step further and center your Conversion Rate Optimization and lower Cost Per Lead efforts with the goal of ultimately lowering your Cost Per Acquisition (CPA). If your sole focus is on lowering Cost Per Lead through CRO, you’re flying with half the visibility and you can miss out on opportunities that are able to generate key revenue.
In order to truly understand whether an ad, ad group, or campaign is generating results for your business, you need to track your conversions (customers) all the way back to your clicks. Take this for example…
Let’s say you’re running a search campaign in Google Adwords. You have a Single Keyword Ad Group that contains two ads. And you’re running a split test between the two ad variants. Depending on your ad budget, let’s say you end up generating 20 leads through each of the ads. That’s 40 leads total.
In this case, you’ll probably look at two things to determine which one you should stop running:
The number of leads divided by the number of clicks (Conversion rate)
Spend divided by the number of leads (Cost Per Lead)
Naturally, you’re looking to find which ad generated these leads for you at the lowest average cost:
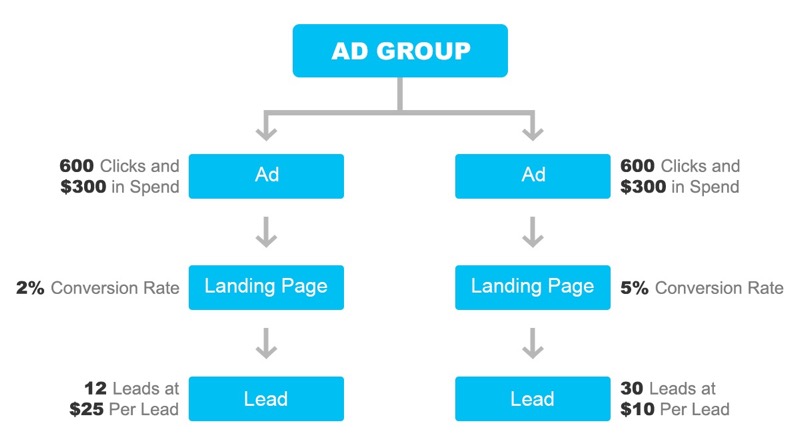
Thus, you’ll cut out the ad with the lower conversion rate which will also have the higher Cost per Lead. In the example above, the landing page with a 2% conversion rate would get the axe. Makes sense, right?
But not always. What if…
You convert fewer (%) leads into paying customers from the lower CPL ad? Maybe the other ad was better after all?
You take a chance and keep running both ads but the other ad now has a lower CPL? Maybe you just had to spend a bit more?
Because of this, your ROI is never going to be in sync with your decisions about which ad variant you need to continue optimizing.
So how do you get clarity into which ads are actually generating revenue for your business? Use the Cost Per Acquisition to as a measure of performance. Here’s how that scenario could look:
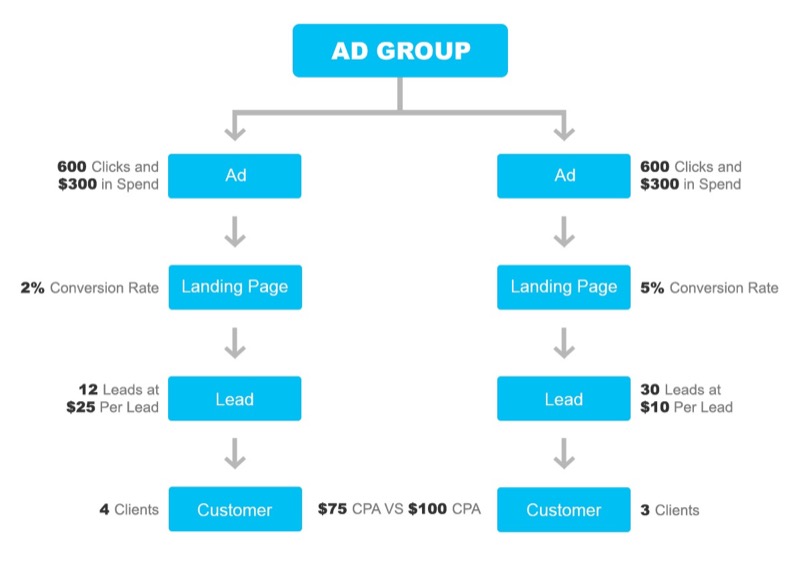
See how clear the results of your campaigns align with your business’ goals?
When you get this level of clarity into your marketing campaigns, you’re able to make smarter marketing decisions and get the most out of every ad set.
Taking it one step further
Getting deeper into this thought, let’s use another example where you’re running 2 ads and your target CPA is $60. You know that if it costs you more than $60 for you to generate a customer, then that marketing effort or ad won’t make sense for you. Pretty straightforward.
Now if you spend $400 for Ad #1 and Ad #2 for a total of $800, you might get a scenario like this:
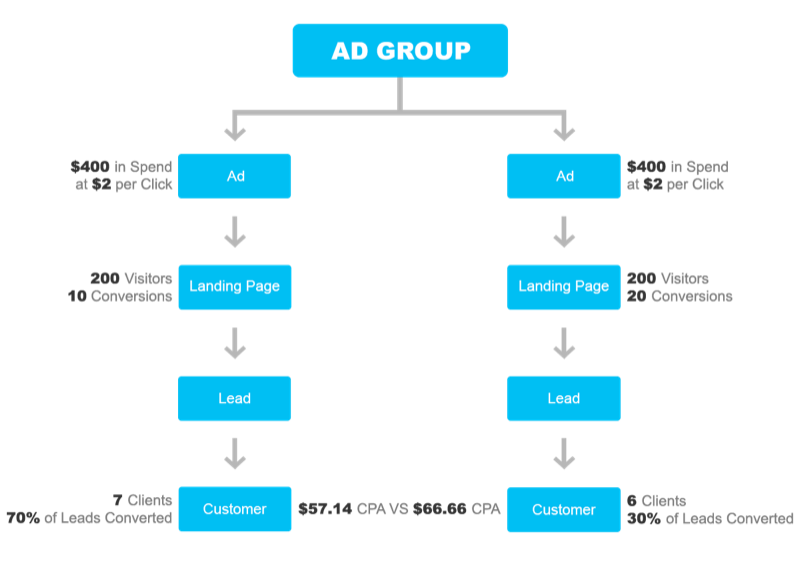
In this case, the decision seems easy, right? The second ad clearly isn’t performing as well, so we should cut it, right?
But what if we just decrease the Bid, therefore decreasing the Cost Per Lead for the second ad and spend another $400 for each ad? We might see something like this:
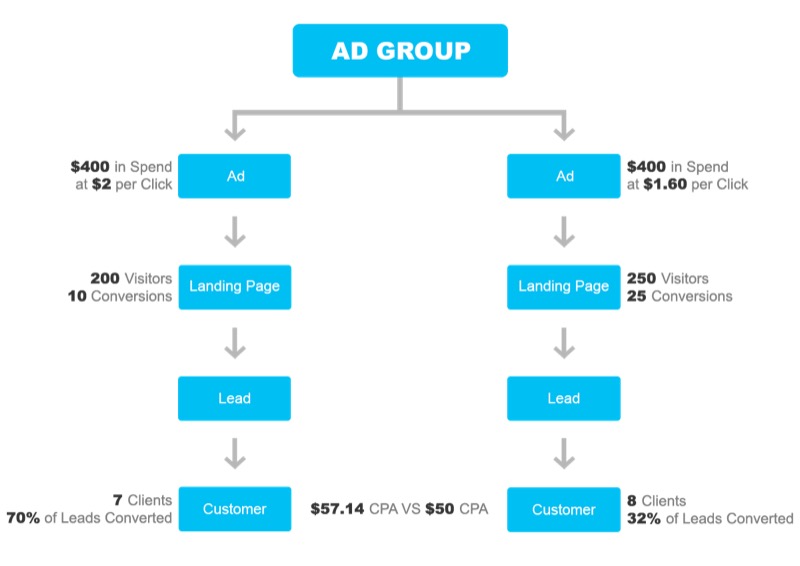
Instead of killing the second ad, maybe we just had to decrease the Bid?
On a side note, you can effectively decrease your Cost Per Lead by increasing your conversion rate on your landing pages (Conversion Rate Optimization) by using tools like Convert or by increasing your Quality Score. However, in this case, we’re looking for some quick changes in our Bid for faster results.
The best way to check out a tool is by exploring it. Get full access to Convert for 15-days for free. A/B test, check out all our integrations and see why so many optimizers chose Convert Experiences as an Optimizely alternative.
The CPA for E-Commerce Funnels
For e-commerce websites, the concept is simpler. You can report the value of each conversion directly to Google Adwords or Bing Ads to give you a clear picture of CPA or ROI, all in your dashboard. This is because what your platform sees as a conversion and what you see as a conversion are the same. They both translate into revenue.
However, to get this to work, you’ll have to edit your conversion tags, whether it be from Google Adwords or Bing Ads, and send the conversion value of each successful checkout back to the platform.
Reporting on CPA
So how and where do you track your CPA? As mentioned above, for e-commerce funnels, you can rely solely on your Google Adwords or Bing Ads dashboards to compare your CPA against each ad or ad group.
For lead funnels, you have to use the Offline Conversion Tracking feature. This is the key to tracking CPA and not enough marketers do this. If you’re an agency, you have to require your clients to send an Offline Conversion Tracking file back to you so that you can upload it and see which ads or ad groups are generating value for your clients.
You can navigate directly to the Offline Conversion Tracking page of your platform for clear instructions on file formatting and how to upload them. Some CRMs may even have standardized export features available specifically for Google Adwords such as Salesforce Sales Cloud.
Now if you really want to get to the next level with your reporting, you have to do it outside of Google Adwords or Bing Ads. The shortcoming with both of these platforms when you use Offline Conversion Tracking is that conversions are the only thing you can track. You can’t upload dispositions of leads that may be further down the funnel than others.
For example, let’s say you have two ads where your CPA is the same. You’ll also have a portion of leads that didn’t convert, whether it be because they weren’t interested or they are interested but didn’t convert yet. But what if one ad has a significantly higher percentage of leads that are “interested” than the other? How is this valuable when “interested” leads don’t actually translate into revenue as mentioned earlier?
When you’re able to track all dispositions for all of your leads, you can also get some insight into your sales process and where you can improve. For example, if you have an ad that has a form conversion rate or a click to lead rate of 10% (very high) but a very low lead to conversion rate, then maybe it’s not that your ads are underperforming, rather it could be that your sales team could use some improvement.
Now to get this type of reporting, you have to use a third-party tracking platform that integrates with your SEM dashboard. But for those with lower budgets, use a spreadsheet to copy and paste exports from your CRM and Google Adwords. A nice set of preset formulas should be able to spit out these numbers to you easily.
In any case, it requires a bit of extra effort to get this level of reporting. But once you begin using CPA as your primary performance metric, your return for your marketing campaigns will become clearer than ever and you’ll be able to offer much more value for your clients.

Written By
Phillip Koo

Edited By
Carmen Apostu


