How Slow Devices Pollute Your A/B Tests (And How to Diagnose It)
When you run A/B tests, you most likely have your tool firing its script in one place and Google Analytics firing in another. Very rarely do both tools agree on how many people saw your test.
This disagreement usually reads as a small, annoying thing you learn to ignore. Until it’s not small. Now you’re wondering: Which tool is right and how do I even begin to tell?
Ryan Levander took the first pass at answering this in Why The Data Doesn’t Match Up When Analyzing Test Results. He argued that the two tools will never match exactly. Rather than chase strict accuracy, you should focus on spotting the trends and patterns the data provides.
He left us with this rule of thumb:
If your bottom-of-funnel conversion tracking (purchase, lead, free trial, phone call, etc.) is off by more than 5% between systems, investigate why.
But he doesn’t say where to start looking. This piece points you to one specific place that most test analyses miss.
Where to Look First When the Gap is Real
When you spot a test data mismatch, often your gut instinct is to check the configuration. Maybe there’s a problem with the GTM triggers, event names, dimension scopes, consent banners?
You may also rightfully suspect attribution model differences, bucketing moments that don’t line up between the two tools, bot filters, GA4’s own sampling and thresholding, cookie rejections, ad blockers, IP filtering… the list goes on.
These are worth checking and can explain some cases. But there’s another: Network conditions and device performance.
The tracking script of many A/B testing tools (like Convert Experiences) sits synchronously in your site’s <head> tag and fires the moment the page starts loading. Google Analytics 4 (GA4) loads asynchronously and fires when the browser allows, which depends on the network conditions of the visitor.
Network conditions impact the connection between the visitor and your page.
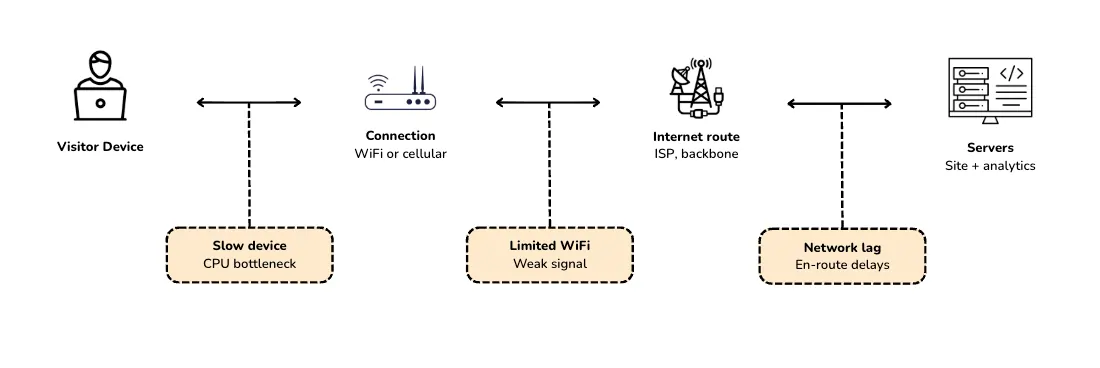
The network impact points are made up of factors that determine how fast their devices process JavaScript, how strong their connection is, how congested the route back to Google’s servers gets, and how many other scripts are fighting for the same browser resources.
At any point, the analytics beacon may be delayed, partially delivered, or dropped entirely.
One Suspect Most Analyses Miss: Slow Devices and Limited WiFi
There’s something that happens to GA4 when the visitor’s device or connection can’t keep up.
GA4 is built to send events asynchronously. What this means is the event is queued behind whatever else the browser is doing, which is good for page performance since it won’t block rendering. But it’s bad for data completeness.
On a fast device with a good internet signal, that queue clears in milliseconds. You won’t even notice it. On a slow device or a flaky connection, it doesn’t clear fast enough. And if the visitor leaves before GA4 is loaded, the page_view never sends.
These “slow” devices aren’t edge cases. They’re the five-year-old Android phone on hotel WiFi or a laptop on a congested coffee shop network. And they make up a significant slice of your actual test audience.
Even in the US, where networks are strong by global standards, only about half of connections are on 5G as of 2025. The rest run on LTE or slower. And “on 5G” doesn’t mean “always fast”. Most of the time, even 5G customers are on 4G or worse, according to this Opensignal report.
This chunk of users on slow devices and slow networks creates data (or the absence of it) that makes your testing tool and GA4 disagree.
But being aware of this isn’t enough. You need to know what that drift actually looks like to diagnose it. At Convert, we spent the past couple of years researching and measuring it.
Our Methodology
The findings here come from nearly two years of Convert’s team debugging GA4 implementations across dozens of live customer sites. Here’s what the research covered:
- Throttled environments: Slow 3G, 4G, and limited WiFi conditions simulated through Chrome DevTools and tested against real mobile devices. This mirrored what actual visitors experience outside of our fast-broadband offices.
- Live customer sites across industries: The team instrumented production GA4 installations on dozens of Convert customer sites and watched what happened when visitors hit them under network stress.
- Side-by-side GA4 vs synchronous tracking: Every finding was cross-checked by comparing GA4 against Convert running on the same site at the same time. When GA4 and Convert disagreed, the team could isolate whether the difference was genuine behavior (such as different visitors or different definitions of a session) or genuine data loss.
- GA4 deployment patterns: Both Global Site Tag and Google Tag Manager setups were tested, because how GA4 is loaded changes what it captures. And that turned out to matter more than most implementations assume.
The research wasn’t designed to prove GA4 is broken. Rather, it’s meant to explain the gap Ryan flagged, i.e., why the numbers don’t agree when both tools are configured correctly, by showing what’s happening in the browser when the network fights back.
The findings below are what the data kept surfacing. Some of them are covered in Google’s documentation. But we found out things that aren’t. One of them contradicts a common GTM advice that’s been passed around for years.
3 Patterns That Explain GA4’s Slow-Network Data Loss
Here are the three patterns that showed up most in the slow-network-slow-device controlled environment we studied:
1. The 20-second First-pageview Delay
Under slow 3G or 4G conditions, GA4’s first page_view event frequently fires only after 20 seconds or more.
20 seconds is a lot of time for an actual visitor. Enough for a shopper, for instance, to click through from a Google search on a crowded train, skim your page, and leave. By the time the first event is sent, the visit is over. GA4 never registers that session. And even though they participated in your test, they’re not recognized in GA’s analytics.
Convert runs synchronously in the <head> and has already logged that visit. This is the single biggest driver of the GA4-Convert gap on slow connections. But it isn’t documented anywhere in Google’s official documentation.
2. The Funnel Shape That Gives Slow-network Loss Away
If slow-network data loss were random, it’d be hard to spot. The numbers would drift a little everywhere — sessions off by 3%, add-to-carts off by 3%, purchases off by 3% as well — and you’d shrug and move on.
That’s not what the data looks like.
Our research found that under slow-network conditions, the biggest gaps between GA4 and Convert’s data show up at the funnel entry and final conversion. The middle of the funnel looks almost fine.
This happens because GA4 ties every event to a session, and it ties every session to page_view. If the first page_view never fires, the session doesn’t exist in GA4. Every downstream event from that visitor also doesn’t exist.
Mid-funnel events look healthier than they should because visitors who make it past the first 20-plus seconds have, by definition, cleared the loading bottleneck. Their subsequent events fire on time. That’s why the funnel-middle looks consistent.
But the visitors who dropped off in those first 20 seconds are missing from the conversion rate denominator and the conversion count itself. GA4 undercounts both.
3. The GTM “Window Loaded” Trap
You’ve probably heard the advice that you should fire your tags on “Window Loaded” instead of “Page View” to improve Core Web Vitals.
While waiting until the page is fully loaded means your analytics tags don’t compete with critical rendering resources, this increases the risk of missing sessions on slow networks. Page speed reports look better, but it makes analytics worse.
How to Diagnose Your Own GA4-Convert Experiment Data Mismatch
Our support team reports that a gap of 5-10% between Convert and GA4 is expected once all known implementation issues are resolved.
If your gap is under 5%, it’s probably not worth the time. If it’s well above 10%, something specific is driving it. The steps below will tell you which.
Step #1: Compare the Metrics
Before anything else, make sure you’re comparing Convert Visitors to GA4 Users, not Sessions.
Convert counts unique visitors per experiment. GA4 Sessions count visits, which can count the same person multiple times. Comparing them is apples-to-oranges and will create a gap that doesn’t exist.
If you’ve been using GA4 Sessions, redo the comparison with Users and see what your real gap is.
Step #2: Segment GA4 to Only the Visitors Exposed to the Experiment
If you have Convert’s GA4 integration enabled, Convert sends an experience_impression event into GA4 with a value like CONV-[experiment_id]-[variation_id]. That event lets you build a GA4 audience from exp_variant_string in GA4 admin.
Use either to filter your GA4 report down to just the visitors who were actually part of the experiment. Compare that subset’s User count to Convert’s Visitor count. If you skip this step, you’re comparing Convert’s experiment visitors to GA4’s entire site traffic. That’s a guaranteed mismatch.
Step #3: Align Dates, Time Zones, and Wait for GA4 to Catch Up
Match the exact same date range in both tools. Align the report time zones manually. And wait at least 72 hours after the period closes before drawing conclusions. GA4 can take that long to fully populate.
Compare week-over-week rather than day-by-day. GA4 attributes events based on processing time, which means day-level comparisons can look noisier than they really are.
Step #4: Segment by Device and, If Possible in Your Analytics Tool, By Network
Pull your GA4 report filtered by device category. You’re looking for the delta between desktop visitors and mobile visitors. If the gap between Convert and GA4 is small on desktop but large on mobile, you now have a new top suspect: network conditions.
Convert’s own reports can segment by device, browser, country, and campaign source, but not by connection type or network speed (True network-speed dimensions were never really available on the web side, and the closest proxies, Universal Analytics’ Service Provider and Network Domain dimensions, didn’t carry over to GA4 when it launched in 2020.) This step is mostly a GA4 exercise, with Convert as the reference point.
Step #5: Audit Your GTM Triggers and Script Placement
If your GA4 tag is firing on Window Loaded, DOM Ready with a delay, or a custom trigger waiting on other scripts, change it to fire on Page View. Every millisecond of added delay widens the gap on slow networks.
Also, check the order. Convert should be installed directly in your site’s <head> tag, not via GTM and not below GA4. If Convert is behind GA4 in your page’s load order, reverse it.
Step #6: Compare the Funnel Shape
Pull conversion funnels from both tools side-by-side. Look at the percentage gap at each stage, from session/user entry to mid-funnel events, and final conversion.
If the gaps are largest at the top and bottom of the funnel and smaller in the middle, you’re seeing the network-loss signature we learned from our research. Visitors drop out of GA4 before their first page_view fires, which erases them from the user count and the conversion count while leaving mid-funnel looking fine.
If the gaps are evenly distributed across all stages, something else is driving the discrepancy, likely configuration or a genuine behavioral difference in how the two tools define a conversion.
There are various reasons for a data mismatch between GA4 and your A/B testing tool, such as Convert. While this article discusses one lesser-known reason and the steps above diagnose one slice of the gap, step 6 is the cleanest signal that network conditions are or aren’t the main driver.
Step #7: Cross-check with Server-side Data
If you have server logs or a backend CRM that records conversions, pull the same-period counts from there. Server-side data doesn’t depend on a client-side script firing in time, so it’s a third reference point.
Convert exposes a server-side API for posting goal conversions back into its reports, which makes this comparison easier when the experiment outcome is a server-side event (a completed checkout, a backend-confirmed lead, a subscription renewal). If server-side counts are closer to Convert’s than to GA4’s, that confirms client-side network conditions are causing GA4’s shortfall.
The Next Time GA4 and Convert Disagree
Ryan originally made the case for not chasing accuracy. He’s right. A/B test data and GA4 will never match exactly, and the gap will never be zero.
But “don’t chase accuracy” doesn’t mean “don’t investigate.” When your gap crosses Convert’s own 5-15% normal range, or lands well inside it but feels wrong for your traffic mix, the cause is often sitting in your visitors’ connection, how fast their devices run, or how much the network lags before GA4 records the first event.
Configuration may explain some of the gap, but your audience explains most of the rest.
The next time GA4 and Convert disagree on a test, you’ll know where to start looking.


Written By
Uwemedimo Usa, Ahmed


Edited By
Carmen Apostu
