Mobile vs Desktop Conversion Rates: Unexpected Gains from Google Analytics
You probably have a well-oiled CRO machine that is constantly testing different creatives and content for the best conversion rates.
But get one landing page and shrink down the width of the browser manually. Your page is probably mobile responsive so the content and layout change multiple times as the screen width shrinks down to the smallest size. Each unique rendition of your page based on its width is its own variant, and you should be monitoring the performance of each one separately.
But do you have a system of tracking conversion rates between pages for each screen size? For most CRO/SEM Specialists, the answer is “no.”
There are a couple of challenges with this.
Too many screen sizes: There was a time when the first iPhone was the only smartphone screen size that developers cared about. Now, there are countless screen sizes from different device manufacturers. Expect every variation of your page to be viewed.
Good ideas are developed with desktop in mind: Development happens on a desktop computer. But content is usually consumed through mobile devices. Sure, ad networks like Facebook and Google provide options to send users to mobile versions of your website or restrict ad delivery based on desktop vs mobile. But this isn’t specific enough. There are numerous different mobile device screen widths and if your website is responsive, it probably has numerous variations of its mobile version.
Mobile is focused on responsiveness: When getting a desktop creative and developing a mobile version of it, the focus is usually on responsiveness and not conversions, which is very different from how the page was originally designed (for desktop).
So how do you know if your conversion rates are struggling on different screen sizes?
Monitor Performance Using Google Analytics
There are several reports you can use in Google Analytics that will give you the insights you need to monitor any irregularities in your conversion rates due to technical variables. If you work to correct these, they’ll prove to be easy wins for your CRO.
Mobile vs. Desktop
You have a standardized report in Google Analytics that tell you your conversion rates on mobile devices versus desktop devices: the Mobile Devices Report. It can be found by navigating to the Mobile Devices Report of your Google Analytics account (Audience > Mobile > Devices).
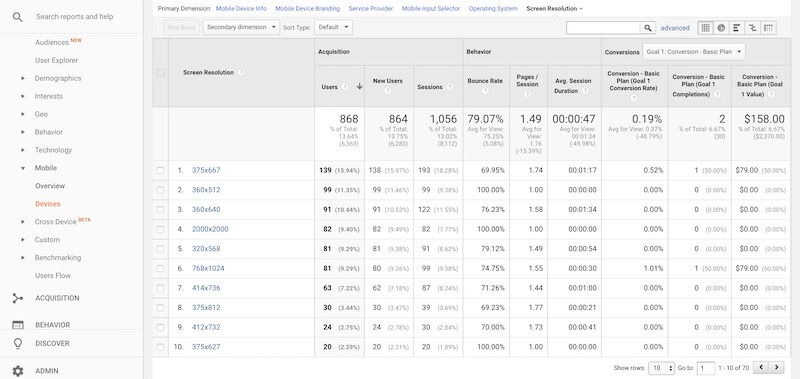
The Mobile Devices Report gives you a comparison of conversion rates across different mobile devices. For example, if you find that your conversion rates are lower across devices that are “phablet” sized, you’ll know that this rendition of your content is not optimal for users with this screen width.
Speaking of screen widths, there’s no need to do device width calculations against your Mobile Devices Report. Under the Primary Dimension section, there’s an option to view conversions against Screen Resolution, which will be easier for your developers and marketers to digest as they emulate the variants with concerning differences in conversion rates.
Content Interaction
If you’re tracking content interaction through Events, as outlined in my last article (you should really be using Events), you can easily create a custom report in Google Analytics that compares conversion rates against Screen Resolution AND events.
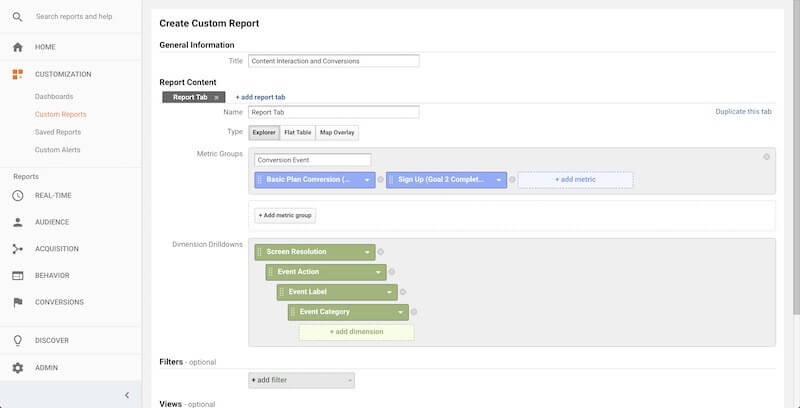
This report will answer the following questions:
- How much are users interacting with certain elements based on screen resolution?
- Are those interactions (or lack thereof) resulting in conversions?
Easy Wins
A lot of factors will contribute to a successful CRO program. On the other hand, it’s necessary to monitor certain aspects and user behavior to see if a technical problem or a design issue can be easily resolved to gain some quick wins.
Google Analytics is a staple in the kit of most marketers. But there is more depth to this free tool than you think. Convert is happy to present a series of advanced Google Analytics blogs by ace marketer Phillip Koo of Fluent Group. Check out the first post here.


Written By
Phillip Koo

Edited By
Carmen Apostu
