A Complete Guide to Using Google Analytics in CRO
5 Hidden Opportunities with Google Analytics
On your endless quest to improve your CRO, you’ve likely come to rely on Google Analytics as a handy KPI gadget. It’s that trusty wrench in your CRO toolbox that you turn to when the numbers don’t add up, something is leaking in your automation and you’ve got to take a look under the sink (minus the plumber crack).
But when it comes to reliable data, one pesky problem keeps rearing its head.
We’re prone to blind spots and errors.
It should come as no surprise that reliable data sources are generally not set up well and that data interpretation is prone to cognitive biases.
Despite entering the age of big data, our evolving brains are still wired for story and narrative, not data. That means we are naturally inclined to make the data work for our purposes.
Has this happened to you?
You find an outlier. Your inner detective (and ego) says ”Aha!”, only to feel deflated, (dang it!)… It was a lack of proper Google Analytics experiments setup.
Don’t feel too bad. We’re conversion optimizers, not scientists conducting clinical trials for a vaccine.
From tag setup mistakes to scripts not firing correctly, there’s a certain level of hyper-vigilance required to build a solid foundation for your analytics and A/B testing.
Let’s dive into how to use Google Analytics for CRO in 2021 and then lay out 5 hidden opportunities for your Google Analytics experiments.
Why Use Google Analytics?
Even if you’re a whiz, here’s a quick refresh to reassure you that, even in 2021, Google Analytics is still a CRO gem.
1. It’s Free
Who doesn’t love free? Don’t be fooled by the cheap price tag, however. Free doesn’t make Google Analytics any less valuable. If anything, it’s the opposite.
But if you maximize this tool, it’s truly astonishing how many golden nuggets for conversion opportunities exist.
And why not get the most out of a tool you already know how to use? Think of this: if our brains drain like a battery throughout the day, you want to limit the number of tools in your workflow.
2. Easy to Set-up
Free AND easy to set up? Ah, yes. Now you’re talking.
Don’t have Google Analytics set up yet? While it’s easy to configure, it’s worth repeating that the proper setup of Google Analytics is the essential foundation for your entire conversion optimization strategy.
Of course, no setup is complete without seamless integration. And you’ll sleep better knowing how easy it is to use alongside your other CRO tools, like Convert Experiences.
If you’re already confident in your setup, and simply looking for more visual appeal in your reports, configure with Google Data Studio (or a similar alternative to Data Studio), by adding a simple script to each page or use Google Tag Manager.
Run your tests with an A/B testing tool that plays well with other software. Convert Experiences integrates with 100+ tools that may be in your tech stack.
3. Most Customizable Tracking & Reporting Options
Google Analytics remains the most customizable tool to see a deep level of user interactions, such as where users are dropping off, and determine which fields are causing friction or cart abandonment.
And not to sound like your mother, but there is merit to trusting the authorities on the subject.
SEO expert Neil Patel is a big fan of these pre-set custom report features in Google Analytics. Whether measuring conversions for PPC campaigns, blog optimization, customer behavior, site diagnostics, funnels, or across browsers, you’ll find the reports you desire.
You can also easily install these custom reports to have at your fingertips. This level of detail and reporting can help you accelerate your conversion rate.
How to Find Data Opportunities in Google Analytics
Before finding opportunities, make sure to complete these 2 steps:
- Setup GA correctly (especially Event Tracking)
- Decide what to track using custom reports.
Then, dig into each of these 5 areas to find hidden treasure:
- Form Optimization
- Blog Optimization
- Page Optimization
- Funnel Optimization
- Optimization for Screens and Devices
Opportunity #1: Form Optimization
Google Analytics can help you optimize all types of forms. These include subscription forms, contact forms, payment forms, sales forms, landing page forms, and multi-page forms.
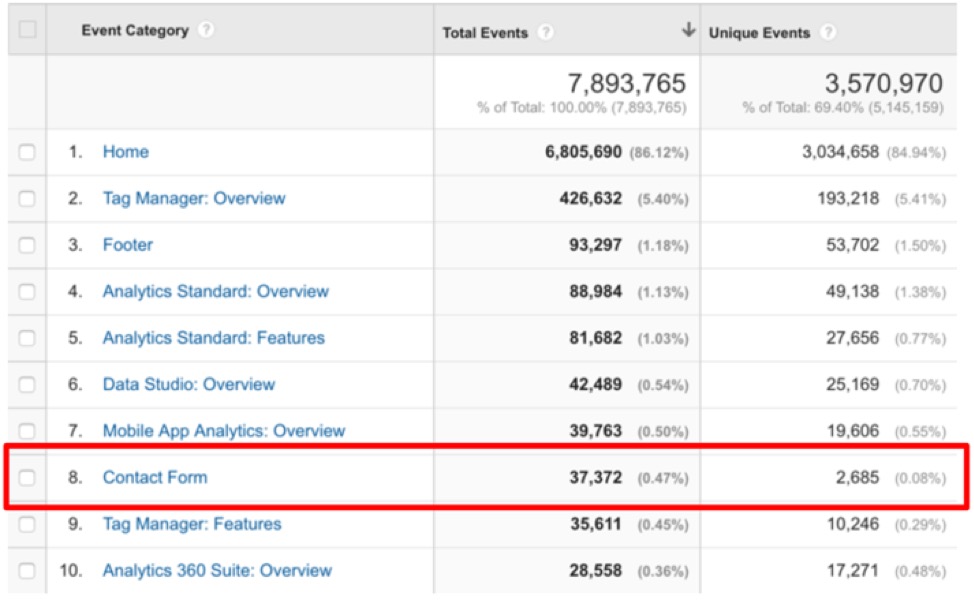
Using Google Analytics Event Tracking is a great way to track form field interaction on your sites and to create fallout funnels to understand the success or lack thereof for your forms.
Krista Seiden, principal digital analytics consultant at KC Digital
Krista explains how she uses event tagging in GA for form field tracking. (Form completion is a type of event tracking.)
Let’s say you notice a form is consistently incomplete.
In the GA report, you can
simply reorder the table and quickly notice drop-offs or increases. You would more easily be able to recognize the people who did not see the required asterisk and encountered an error.
Krista Seiden, principal digital analytics consultant at KC Digital
Opportunity #2: Blog Optimization
When it comes to blog optimization, Johann Van Tonder of AWA Digital suggests:
Understand your conversion potential. Not every visitor on your site is there to convert. What is the size of the opportunity? Knowing this also allows you to focus all your efforts on the real opportunity without getting side-tracked by big meaningless aggregate numbers.
To briefly explain the concept, here’s a simple example:
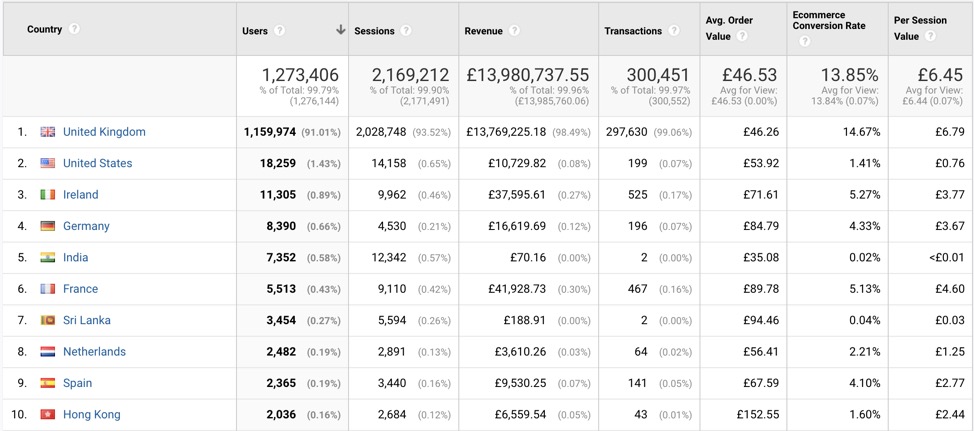
Let’s say your target market is the UK, but GA shows that 15% of your traffic is from non-UK countries that convert poorly or not at all. In this scenario, the true conversion potential is closer to 85% of the total website population.
An e-commerce business I recently looked at has high-ranking blog content which accounts for 48% of all traffic.
However, the propensity to convert (not eyeballed, but calculated using logistic regression models) for that segment is minuscule. It turns out these users are visiting the site only to research a specific question that is answered by this blog content.
You can try to sell them something all you want, but they’re not in a buying frame of mind. At some point, they may need exactly what you have to sell, but that time is not now. The way you approach this opportunity, both from an analysis and testing perspective, is completely different from one characterized by warmer traffic.
Opportunity #3: Page Optimization
Let’s say you’re A/B testing for 2 variants on a landing page. You decide you want to learn which elements have the most engagement, such as dwell-time or mouse-overs.
It’s easy to lose sight of why you made the change in the first place. Was it creativity or data-driven? Especially with more hands in the mix, such as a UX designer, developer, and strategist.
Phillip Koo of Fluent Group.
You notice that while page A has more engagement, page B has a higher conversion.
And so, you can conclude that while you love an image on a page, is it reducing conversion because it’s too distracting from the goal.
Phillip explains that with Google Analytics, you can correlate this with other elements, like whether they’re mobile users. Then eliminate the element with a shorter page to answer the question “Is the element or interaction necessary to convert?”
Sure, there are other tools that can record behavior on a specific page. But you won’t be able to gather more unique insights to your industry
Phillip Koo of Fluent Group.
Opportunity #4: Funnel Optimization
When it comes to optimizing funnels, Andra Baragan of Ontrack Digital, shared:
There is tremendous value in finding those major drop-off points in our clients’ conversion funnels. Goal funnels are definitely one of the key components of the analytics reporting phase but they have the massive shortcoming of being available only on destination-type goals.
We’ve found that the most efficient way to define funnels is through custom segments.
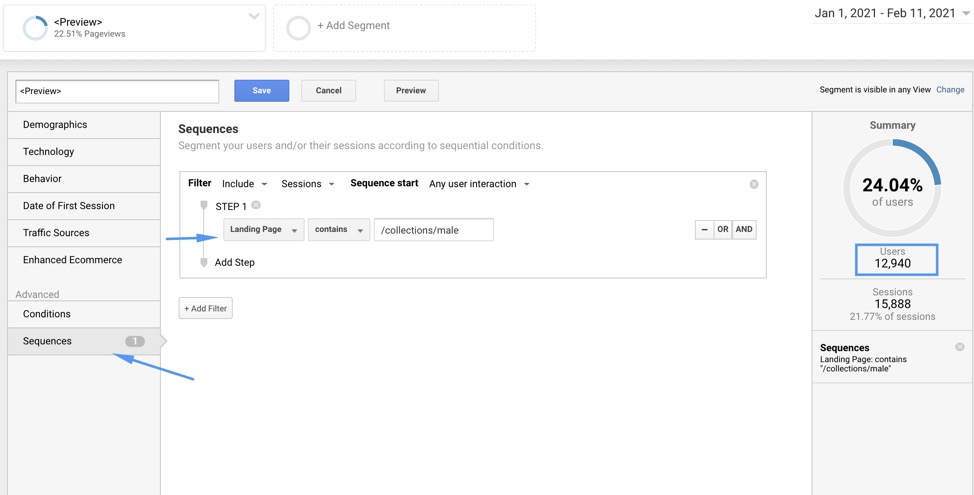
By using the “sequence” advanced setup in the custom segment screen, you can define the steps in the funnel and understand the drop-off on each point through a combination of events and page views.
Andra recommends these steps to spot GA opportunities in your funnel 👇:
1) The first thing we do when optimizing a website, after ensuring the analytics is set up correctly and everything is being tracked accurately, is do analytics reporting.
2) Select the first step in your funnel and write down the number of users.
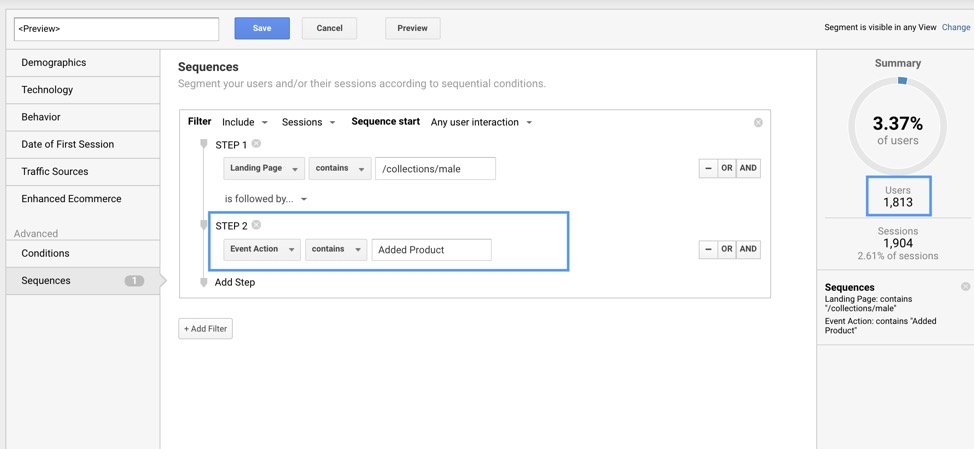
3) Then add the second step in the funnel, write down the number again. You can see we used an event in this case, Added Product.
The drop-off percentage is simply the number of users on step 2 divided by the number of users on step 1, multiplied by 100.
In this example, it’s 1,813/12,940 * 100 = 14% → this means only 14% of users are adding a product to their cart, with a drop-off rate of 86%.
This way, you can create complex funnels for your website, and then, as soon as you’ve seen the biggest drop-off, go in and optimize that section as much as you can.
Opportunity #5: Optimization for Screens and Devices
Here’s a scenario:
Let’s say you’re looking for a quick lift with a tech fix. So you decide to check for browser compatibility problems. You immediately find it cumbersome and elusive to manually check on different browsers and devices. You start to get lost in the weeds.
All of this can be solved with Google Analytics. GA allows you to check for usability issues on different browsers, for example, a broken webpage.
Phillip Koo
In Google Analytics, you can check all browsers, including outdated browsers like Internet Explorer.
You might think, wait, Internet Explorer, who cares? That’s outdated and no one uses it.
Dig deeper into your browser report, and you discover that while, yes, it’s true that 40% are using Chrome or Safari, there’s still 10% using IE.
A waste of time? Maybe… Not so fast…
You dig and dig… aha… your visitors across browsers are engaged, but transactions have dropped off.
Now you feverishly start to do the math. And at least for a portion of your traffic on all browsers, you realize it only takes your developer 2 minutes to fix the problem… And if you start to expand your analysis and think, wait, did that happen on sales pages, too?
You can see how collecting this level of detailed data on activity broken out by all the browsers can impact CRO significantly.
For more hidden gems and opportunities using Google Analytics in your optimization efforts, watch our webinar with Fluent’s Phillip Koo: How to Use Google Analytics in Your CRO Efforts.
Interpreting A/B Testing Results in Google Analytics
Proven A/B testing tools like Convert Experiences make testing and optimizing easy. In part, because they integrate seamlessly with Google Analytics.
A holistic, tandem approach of your A/B testing tool with Google Analytics allows you to notice inconsistencies and outliers more instinctively, and course-correct that much sooner.
Most times, the post-test analysis is done outside of the A/B testing tool.
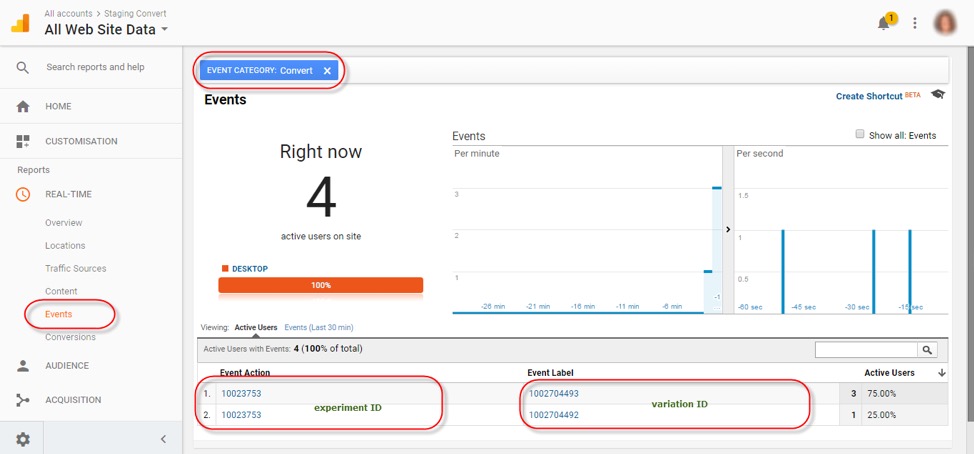
With Convert Experiences, analyzing experiment results is straightforward and easy. Here’s how Convert data shows in GA:
As you can see, when you marry the two, expect to supercharge your optimization with a post-test analysis and deep-dive around user interaction.
Meanwhile, you can cross-analyze insights well beyond what you might find had you spent time analyzing separately (rather than your eyes crossing).
Not only that, but a summary report won’t help you understand the “why” as to what is or isn’t working.
Each test you run should be integrated with Google Analytics. More tests = statistically greater chance of validity and being able to trust that data.
Have your experimentation data sent from Convert Experiences to Google Analytics to build rich reports that can bring valuable insights about how specific experiments perform on certain segments of users. Here’s how to set it up.
How to Access Experiment Data in Google Analytics
After setting up the integration, the experimentation data will start appearing inside Google Analytics. Here’s what being sent to GA (with examples).
In Classic Analytics
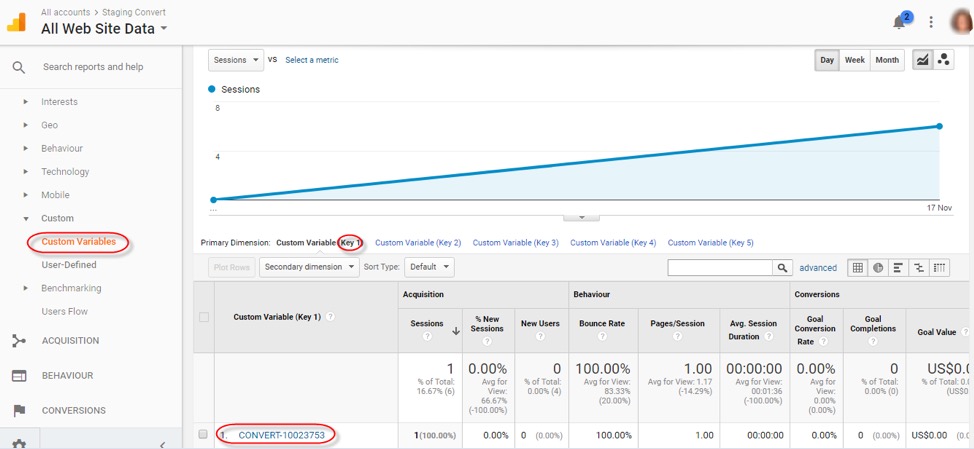
- Go to Audience -> Custom -> Custom Variables. Find the variable named CONVERT-XXXX where XXXXX is your experiment ID.
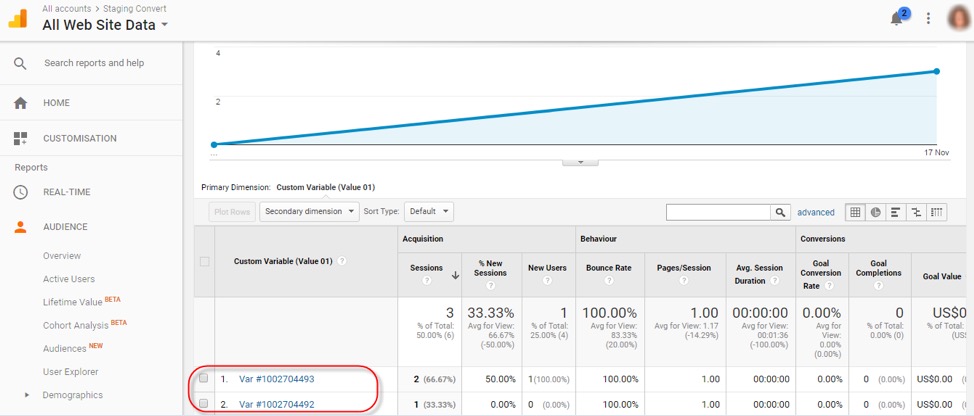
- Under that variable, you will find your testing combinations.
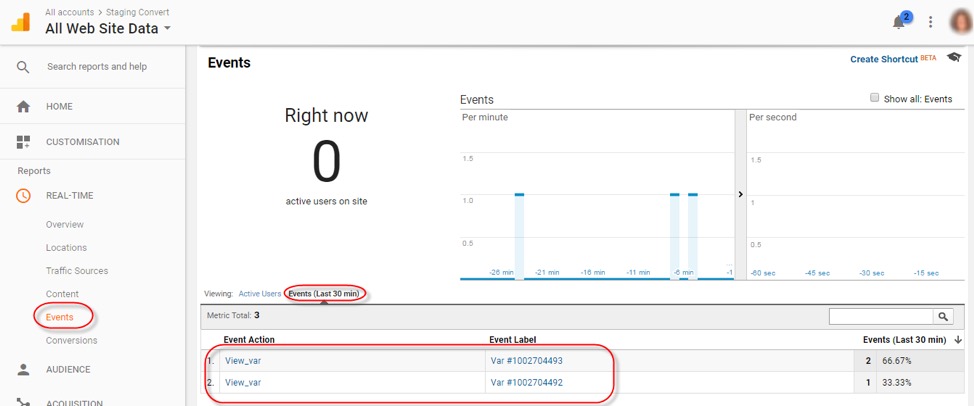
- On each page view of a tested page, we also send an event to Google Analytics. You can find those under Content -> Events. You can use events to analyze, for example, how many times a variation has been seen (and not just by how many visitors).
Check this resource for more details on accessing experiment data in Classic Analytics.
In Universal Analytics
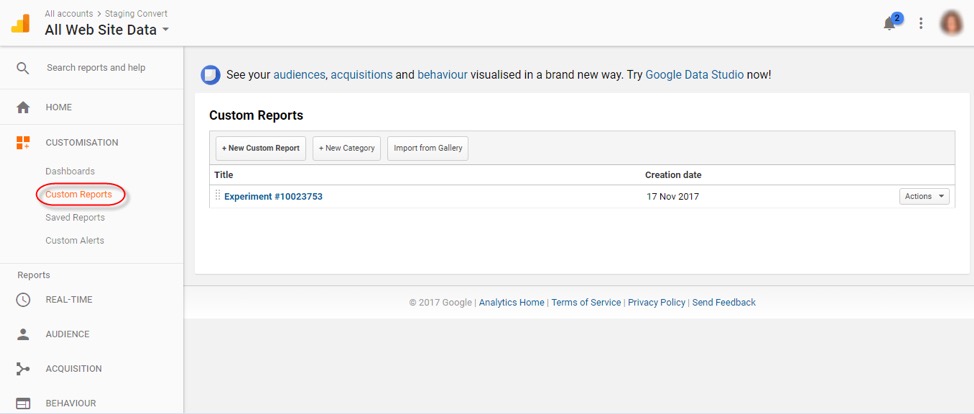
- Go to Customisation, then find Custom Reports:
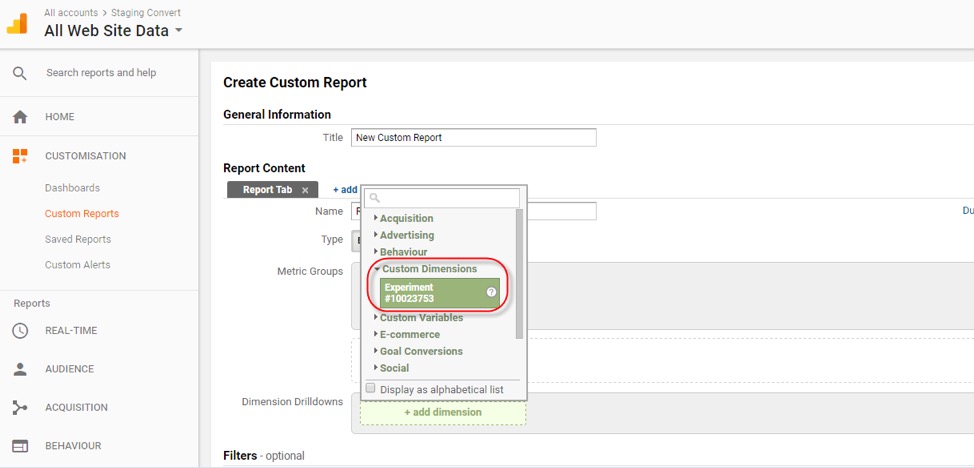
- Create a new Custom Report. Under Dimension Drilldowns, select the Custom Dimension you created in the previous step:
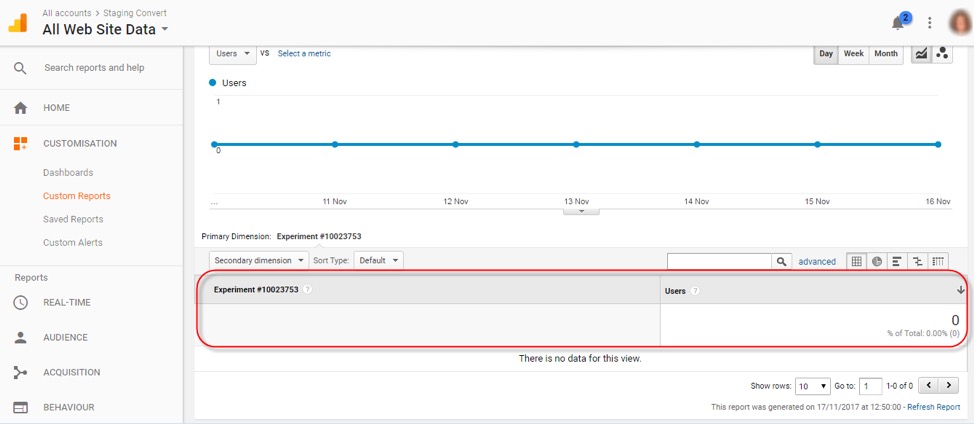
- Once the report has been created, wait until you see the variations and data coming in. According to Google, there could be a 24-48 hours data processing latency.
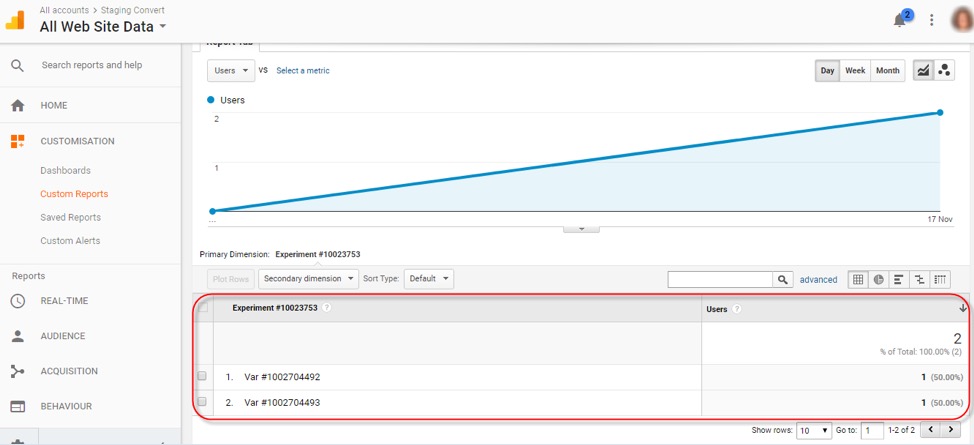
- Eventually, you’ll find each variation of your Convert experiment in a separate row in the Custom Report.
Check this resource for more details on accessing experiment data in Universal Analytics.
A Word of Caution
While you might feel like a kid in a candy store as you discover and savor all the data possibilities of Google Analytics, a word of caution before you rush to ingest heaping gobs of data.
Beware you don’t end up with a case of TMI (too much information). Remember, with more data, there is more room for human error and bias in the interpretation of the data and a greater likelihood of sending you down a long, misguided road.
The key is to build efficiencies and confidence in your processes first.
Take the time to:
- 1) Set up Google Analytics properly,
- 2) Make sure your data is clean, customize for your industry,
- 3) Get your marketers and developers in sync, and
- 4) Incorporate your data into your existing testing methodology with fewer variables.
Only then, you should add on more complexity as you fine-tune your optimization.
Written By
Sharon Pastore

Edited By
Carmen Apostu

