Redefining Discovery: What Success Really Looks Like for Analytics Projects
Why Most Analytics Projects Miss the Mark
Most analytics projects fail from inception because everyone is always “running to optimization”, but no one stops to ask and think critically about, “What are we trying to solve for?”
Ok, there are clearly companies that ask “why” (maybe even the 5 whys technique), but they don’t have a process for going about doing proper Discovery within the context of an analytics project.
When this happens, companies will resort to the simplest solution (how very Occam’s Razor of them), which usually means one of two things:
1. What attribution model should we use? OR
2. Let’s get a tool.
For both, I can’t think of worse ways to basically say “I don’t want to think critically about how we need to handle complex questions as a business, so I’m going to just use DDA (data driven attribution – a black box from Google) or choose another analytics tool to outsource my thinking to”.
After reading this and watching my videos, you’ll have a clear understanding of the Discovery process for Analytics.
What Usually Happens
I’ve seen it time and again: teams get excited about GA4, Looker Studio, or whatever’s hot this month, and they dive straight into charts and dashboards without ever aligning on the business question.
That’s when you end up with what Avinash Kaushik calls “data puking” – reports full of numbers that aren’t solving anything.

If you’re just logging into a tool to check how many users or sessions you had yesterday, cool. But what does that even mean? Is that good? Bad?
Note: The bare minimum of a metric should always have a comparison: WoW, MoM, YoY (usually the best one to avoid seasonality). Also, a range:
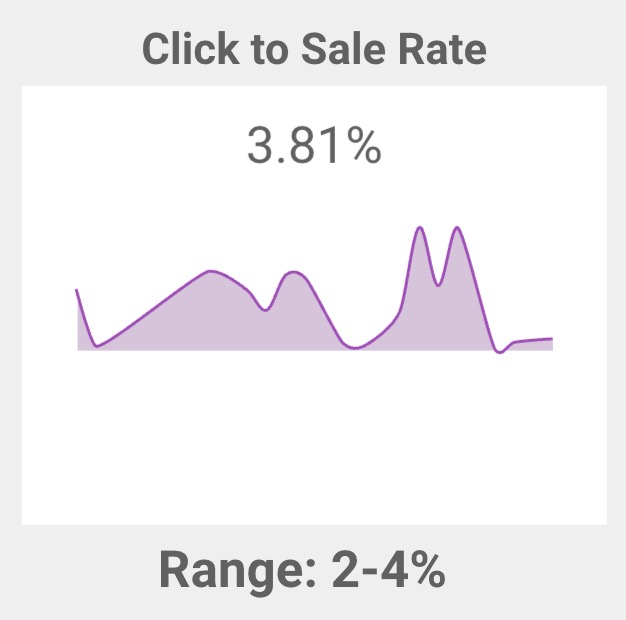
As the number is rarely going to be “exactly right”. We’re not trying to guess here, we’re trying to triage to see if action needs to be taken.
The most common mistake is assuming analytics is about reporting. It’s not. It’s about clarity. Slow down on the front end and define what matters. That’s how you speed up tenfold later.
What Does Success Look Like? (Ask Better Questions)
“Success” can be a loaded word. When you ask a stakeholder what success looks like, you’ll often get a vague answer. Sometimes, they don’t even know.
That’s why I lead with a blunt question early on: “How do you make money?” I don’t care if it seems obvious – I want to hear it from them.
I’ve worked with ecom stores that make most of their revenue after the purchase. If I assume it’s all online revenue and ignore their upsell model or offline flow, I’ve missed the mark.
Once they answer that, I dig further: “What are your highest-margin products?” and “What’s your average customer lifetime value?” (I usually only go 30 days out for this, 90 at the absolute most. It’s really a mistake to project too far into the future because you’re getting into customer service, product quality, etc., where marketing’s impact is long gone. LTV is a “care” metric, not a marketing metric, so Payback Period is a far superior metric to focus on).
Think of how useless a personal trainer would be if your goal was to lose weight and then they ask you “How much do you want to lose?” and you reply, “20 lbs” and then they ask, “Ok. So what do you weigh right now?” and you reply “I don’t want to tell you that”. That would be one short training session.
I’ve seen this happen too much in business. We’re also “settling” for in-platform metrics (Google Ads, Meta Ads, etc) as these are notorious for lying (taking more credit than they deserve). Oftentimes, it’s hard to realize they are.
You have to establish what top line revenue is for the business before starting in order to know the effect you have on the outcome. And let’s face it, if you aren’t doing work that directly or somewhat directly relates to a revenue increase… best of luck justifying that in these times.
Here is a format I use to document the questions that are being surfaced during a kickoff call and added over time:
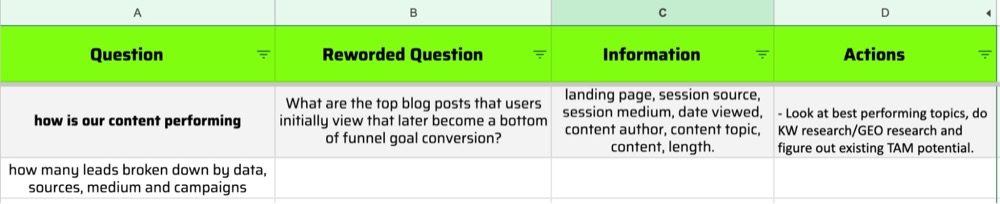
Q = Question (in its natural form)
I = Information (What information do I need – metrics and dimensions, in order to answer this question. This is for the implementor.)
A = Action (What action will I take when I have the answer?)
The Balanced Scorecard Problem: Avoiding Goal Silos
One of the biggest traps in analytics is turning a single metric into the goal. As soon as a number becomes a goal without context, it becomes a target, and targets can be manipulated. You want to double your conversion rate? Easy. Turn off your ads and only let returning visitors hit the site. Your conversion rate will skyrocket – and your business will tank. That’s the danger of siloed goals.
That’s why I always use the “BFF metric” concept from Avinash Kaushik. Every metric needs a contextual counterpart to keep it honest – a Best Friend Forever metric.
You want to boost CTR? Great – what’s your bounce rate to go along with that? Because if you’re writing clickbait ads with no follow-through accountability, your clicks mean nothing. Goals have to be balanced. It’s not just about setting up goals (aka Key Events now) in GA4, it’s about taking your real world business goals and turning them into measurable goals in your analytics platform.
The Discovery Process in Practice: Define, Design, Develop, Deploy (4Ds)
I use a process I call the 4Ds – Define, Design, Develop, Deploy – to make sure every analytics project is grounded in reality and built for action.
Note: “Discovery” does come first – I think about that as the call that sells the system. That can mean you are an agency or consultant selling this, or you are already employed and selling this internally. The point is to share “I have a way to work with more complex analytics projects like this that will make sure our goals are aligned and we reach those goals as quickly and error free as possible.”
- Define: This starts with a kickoff call (with a new client). What are the goals? Where are you in relation to those goals? When do you want to hit them? And most importantly – what do those goals actually mean? Don’t rely on verbal descriptions. Document everything. Build a simple data dictionary as you go.
- Design: Once you know what needs to be tracked, you build a measurement blueprint. What events need to be captured? What dimensions are missing? What custom metrics are needed? I also build dashboard wireframes in this phase. No surprises. I show clients exactly what’s coming so they’re not expecting a pretty dashboard that tells them nothing.
- Develop: This is where you build. Set up tags, GA4 events, BigQuery pipelines – whatever your stack looks like. Everything gets implemented here based on the blueprint.
- Deploy: Push live, test, and connect to decision-making. If you’ve done it right, you now have a system that actually helps the business grow – not just reports what happened.

If you follow this process, you will rarely ever hear “Can you just pull a report for me?” That is useful for no one.
If someone asks you that, the best thing you can do is ask to have a dedicated meeting with them and basically interview them. Dig deep into the questions they are asking (it’s rarely ever just a single question).
It’s not our job to be Google and just give answers to questions (that is also exhausting), we should be problem finders as well… not just problem solvers.

Written By
Ryan Levander
Edited By
Carmen Apostu
