A/B Testing for Content: How to Run A/B Tests with Engagement as KPI
In conversion optimization, the focus is on running experiments to boost conversions and revenue. But for some companies, the aim of optimization is not just acquisition and macro-conversions, but retention and brand loyalty. Media companies and other publishers run A/B tests with engagement as KPI to improve retention and conversions.
But measuring engagement isn’t always straightforward. It requires relying on a combination of micro conversions that will serve as a proxy for engagement. These micro conversions such as bounce rate, average time on page, scroll depth and page views can be combined to get a sense of how engaged your visitors are on your website.
User Engagement Metrics are Useful
While these user engagement metrics may not be money metrics aka macro conversions, they can serve as pointers of what is wrong. For example, high bounce rate on an important landing or product page will adversely affect conversions. So, monitoring rate can help you spot negative trends.
In a case study, BestSelf Co. noticed a high bounce rate on a flagship product page which was affecting conversions. And they hired SplitBase, a partner agency, to fix the problem. SplitBase ran extensive analysis using Hotjar’s heatmap feature to see what is happening on the page, survey and polls to get feedback from visitors.
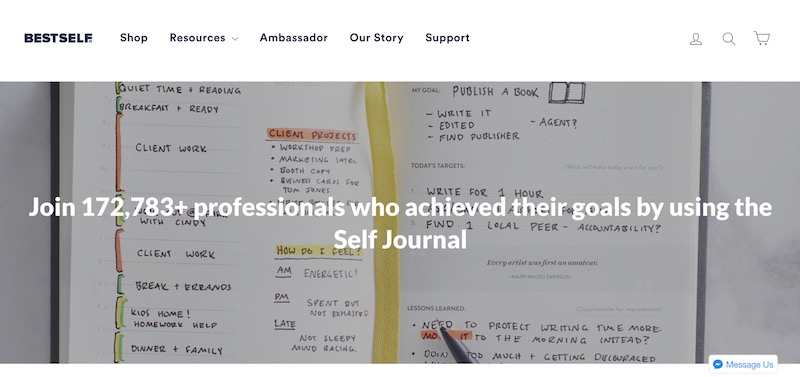
From its analysis, SplitBase found that users weren’t scrolling past the centerfold, didn’t understand how the product worked and mistrusted its effectiveness. Based on these insights, SplitBase hypothesized that adding a headline to the centerfold that clarified benefits and addressed concerns of visitors will keep more of them and lead to better conversions.
Because buyers of the product identified themselves as “professional”, SplitBase used this in crafting a headline with the word “professional” in it, clarified the benefits of the product and added social proof. They designed 2 variations and ran the experiment in Convert Experiences.
Variation 1
Variation 2
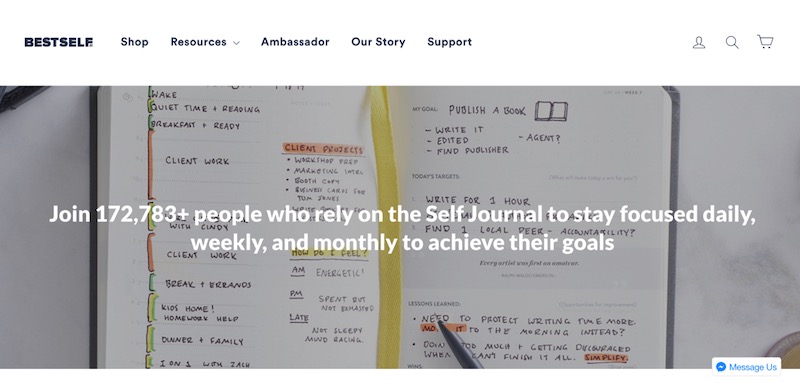
The original lacked any headlines. Each version saw 20,000 visitors over 4 weeks. This was to make sure that the results were consistent and statistically significant. The first variation beat the other versions with a 27% increase in conversions and a “add to cart” increase of 13%.
Let’s move on to how you achieve similar results when you run experiments with engagement metrics.
What does Engagement look like for Your Company?
Before you run A/B tests with engagement as KPI, decide what exactly engagement means for your company. Because engagement is measured by combining different user engagement metrics, deciding which engagement metrics exactly you will combine to measure engagement is important.
The BBC has an experimentation program where they measure engagement as a KPI. When they conduct A/B tests, they use goals such as increasing the views of an article or an episode and the time users spend on their channels. In essence, they use pageviews and average time on page to measure the engagement of their users and ensure that users are getting the most out of their license fees.
When choosing engagement metrics, make sure it reflects the goal of retention and keeping your customers happy. After deciding which user engagement metrics that reflect your goals, you need to establish a baseline measurement of these user engagement metrics.
Establish a baseline measurement of engagement metrics
To establish a baseline measurement, you need to combine 2-3 metrics that are triggered together. For example, you can combine scroll depth and time spent on page (in intervals) to track engagement KPI. Ordinarily, you will want the two metrics to be triggered together once a reader has met certain requirements such as spending 60 seconds on page with 50% scroll depth.
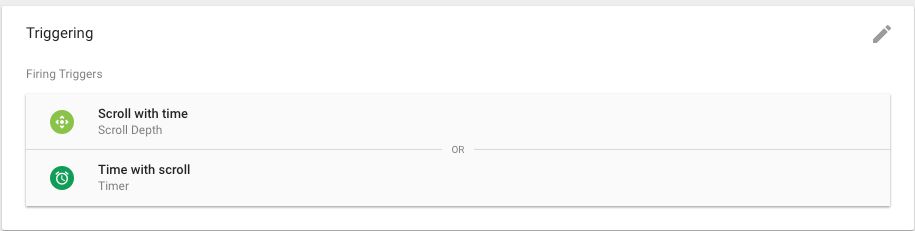
Google Tag Manager has a Timer trigger and Scroll Depth trigger. You can create these two triggers, attach them to one tag while creating a dependency between the two. This way only by meeting the conditions of the two triggers will the tag finally fire. You can then create a new Google Analytics event tag that will fire once the conditions of both triggers have been met. This way you can track it via GA. Simo Ahava goes into great detail on how to create this tag.
Say you create a tag that has a timer trigger of 60 seconds and a scroll depth trigger of 50%. By making them codependent, the tag they’re attached won’t fire until a user meets the condition for both triggers. And you can monitor the event tag in GA to keep a pulse on how your users are engaging with your content.
Using this method to establish a baseline of how users interact with your content can also be helpful for when you run A/B tests with engagement as KPI. As you will have a measure to compare tests results to.
How to Run A/B tests Using Engagement as KPI
The first step in running A/B tests that use engagement as KPI is finding ways of increasing user engagement.
With your established baseline of how users are interacting with your website, you can optimize your website to further improve the metrics you’re tracking, which in this case is engagement. Or you might notice that engagement is slipping month over month and optimize your site with a solution to fix the problem.
Regardless of which reason is prompting you to run A/B tests with engagement as KPI, you need more data. Using a heatmap tool like Hotjar, which integrates nicely with Convert, you can dig in to further identify areas of your website or content pages that need improvement.
- Log into Convert Experiences.
- Go to Compass and input your hypothesis, which you can turn into an A/B test with the click of a button. After designing your variation, it is time to assign goals.
You need to create a primary goal that accurately measures interaction using scroll depth and time on page for your original and variation.
- Click on Goals in the Convert Experiences App.
- Then Add Goal.
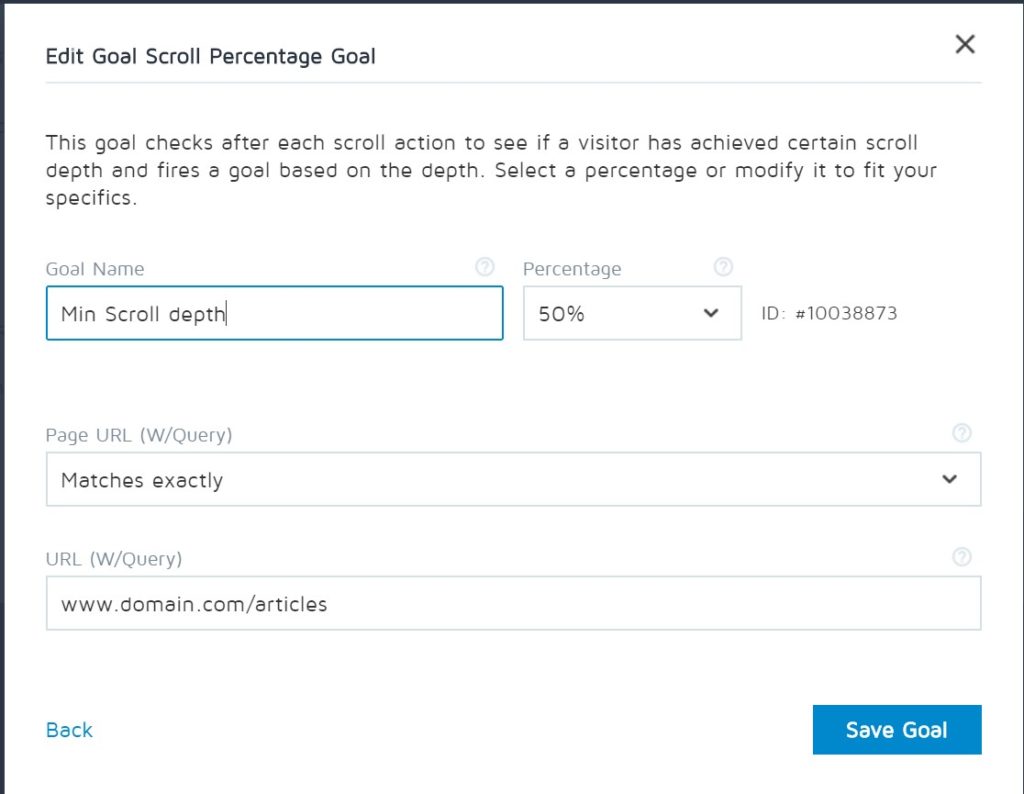
- Choose Scroll depth from the Preset Goals and fill in the scroll depth you want to track and the page URL you want to track. Save the goal.
- Then go to Add Goals again.
- Click on Advanced Goal from the preset menu.
- Choose Average Time on Page. Fill in the time in seconds. You can choose to only track time that either meets your minimum time or exceeds it.
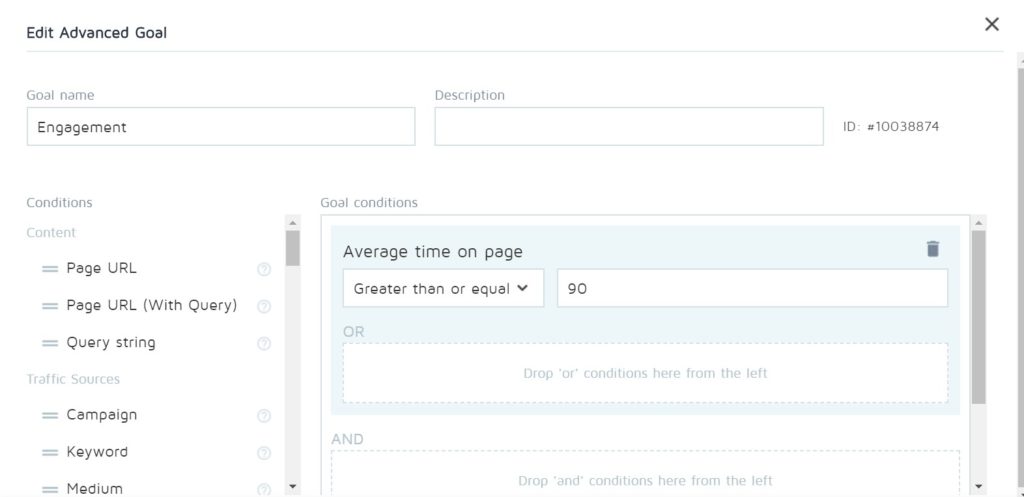
- Then go down the presets and choose triggered goals. Make sure it is in the And section.
- Then select the scroll depth you set up earlier. Save your advanced goal.
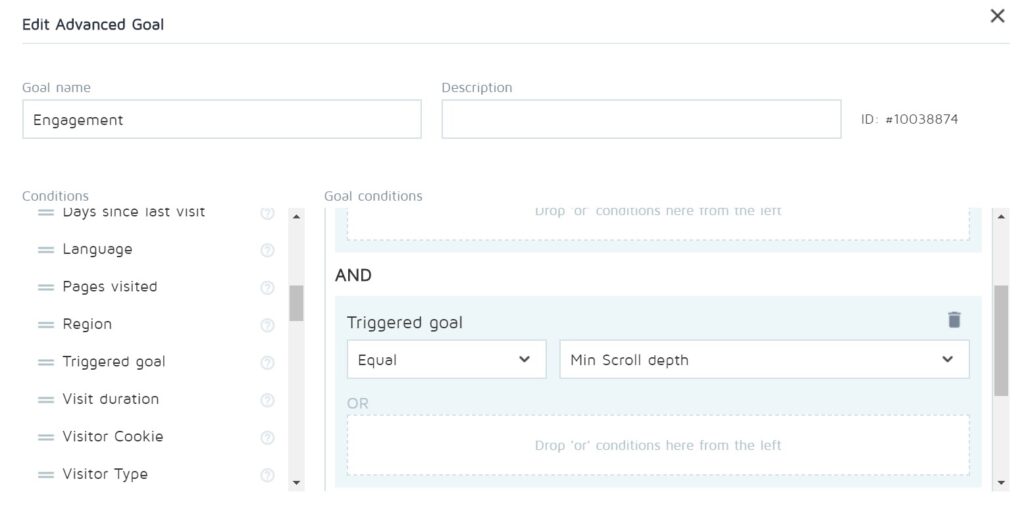
- Make it a primary goal and you’re all set!
You can now track how visitors interact with your variation and original based on these two engagement metrics you have chosen. Run your experiment and declare a winner when it’s statistically significant.
Conclusion
Running A/B tests with engagement as kPI may not be straightforward, it is worth it when your business is focusing on customer retention and loyalty. Making sure that visitors interact with your content, be they blogs or product pages, will keep them coming back!

Written By
Nneka Otika

Edited By
Carmen Apostu
