How to Forecast A/B Test Revenue Impact Without Overselling It


Forecasting the effect your experiments will have on future revenue is a bit of a controversial topic in the CRO world. The reason for this comes down to the fact that we don’t really know for sure if a 10% lift from an experiment will translate into a 10% increase in monthly revenue once the change that was tested is implemented permanently on the website.
Even if the result is valid and you take into account how many users will actually be exposed to the change, there’s an endless number of factors that can affect this.
This is the same reason that A/B testing is better than pre/post comparison: what if performance went down by 10% for other reasons, and the change that you implemented really did increase it by 10%, with the net result being flat?
Maybe the ad budget was reduced, a new competitor started outranking you for important keywords, economic conditions shifted, or there was a holiday just before the change was pushed live.
Let the statistics prove the causality
A big part of having confidence in your revenue forecast is using the right statistical methods at the level of each individual experiment so that you can have confidence in the results. The good news is that just by running a controlled, randomized A/B test, you’re already using the gold standard in proving causality. If it’s good enough for life-or-death questions in the medical industry, then it should be good enough to convince your executives that the change you tested actually has a positive impact.
The caveat here is that you have to be robust *enough* with how you are using statistics. What this means will vary quite a bit from business to business in terms of the individual parameters, but here are the important parts:
- Set your sample size in advance with a reasonable MDE
- Use at least 90% significance and 80% power
- Avoid statistical faux pas like peeking / optional stopping and multiple comparisons without adjusting the stats to handle it.
The quality of your revenue forecast is ultimately dependent on the experiment results that you feed into it, so make sure those experiments are adequately powered and provide a realistic view of the effect that each one will have.
Be conservative with your forecast
We’ve all seen the case studies claiming that a simple test increased revenue by several million dollars. While this isn’t impossible, typically these cases just take the % uplift from the test and multiply it by the annual revenue. So a store doing $20 million per year would make an extra $2 million from a test with a 10% effect.
Unfortunately, this just isn’t realistic, for three reasons:
- Not all of the store’s users will be exposed to the change. Unless it was a sitewide test, you can’t assume that every user will even go to the page(s) where the change was tested. And even if it was, if the change was below the fold, then only the users who scroll could possibly be influenced by it.
- The boost probably won’t last forever. Websites are living things and they change over time. And not all of those changes are tested, which means it’s likely that eventually you’ll ship something that will work against the lift from a previous test. Even aside from that, if you did nothing at all, website performance would decline over time. Call it entropy if you like, but the point is that you need to keep innovating even for things to stay the same.
- The winner’s curse. This is a well-documented phenomenon where the process of selecting winners based on statistical significance means that the winners will be biased towards exaggerated effects. This is related to the nuance between true and observed effect. Any particular true effect size will have a range of observed effects that will result in the true effect being detected. And the ones that pass the bar more easily are the ones at the higher end of that range. What this means in practice is that, on average, the results you see in your winning experiments will be a bit higher than reality.
In addition to the technical stuff, there are more political reasons to be careful with how you calculate revenue impact:
- It helps your credibility, especially in the longer term, if your forecasts end up being close to reality, and if they are off, it’s better to understate than overstate the case. It’s always best to set expectations lower and then exceed them than the other way around.
- It’s actually pretty easy to show high ROI from experimentation programs if you’re doing it right, so you don’t need to exaggerate anything to make the numbers look good.
- It reinforces that you need to keep testing.
What does being conservative with your estimate look like in practice?
- Give the effect an immediate “haircut” before you calculate anything else. I’ve checked and there actually isn’t a more technical / less metaphorical term for this. The idea is that to compensate for the winner’s curse, you reduce the effect size from the experiment by a pre-set margin, like, say 15%. So if you had a lift of 10%, you would use 8.5% as the effect for calculating the impact.
- Hold the impact steady for a reasonable time period. We use 4 months for this. It’s not based on anything concrete (see the next section), but it’s a lot better than assuming the same impact will hold for an entire year.
- Decay the impact by a certain percentage over time. We use 20%, applied to the original monthly impact (not the previous month; otherwise it just tapers off forever and never goes to zero).
With the example above, a 10% lift from a test would contribute:
- 8.5% for months 1 through 4,
- 6.8% for month 5,
- 5.1% for month 6,
- 3.4% for month 7, and
- 1.7% for month 8.
Accept that it’s just a model
A lot of practitioners seem to get hung up on the fact that it’s impossible to say for sure how an individual test or combination of tests will affect revenue in the future. To the point where they shy away from it entirely.
Maybe it’s because we are immersed in a world where everything is quite measurable. Analytics will give you precise answers to a lot of questions. Of course, even then, we accept that it’s not 100% accurate. You don’t have to work in experimentation for long to realize that no two tools agree with each other, and analytics is always a bit off from backend numbers.
But either way, it’s important to realize that the purpose of revenue projections is to report to the executive level, where getting into the weeds of statistical significance and minimum detectable effects will quickly make eyes glaze over. At the executive level, estimates and projections are a standard part of the game, especially revenue forecasts.
The important thing is to accept that we are working with a model, make the assumptions explicit, be conservative, and be realistic about the fact that this is just one piece of a very complex puzzle.
How do we actually calculate this?
With the pieces we covered so far, the actual calculation is fairly straightforward:
- Get the change in revenue per user from the experiment.
- Translate the number of users (both control and variant) from the experiment into a monthly total by taking into account the test runtime to get the number of users who would be exposed to the change once it’s implemented permanently on the site.
- Multiply the RPU delta by the number of monthly users to get your total monthly impact.
- Apply your haircut to get the adjusted impact.
- Hold that steady for some number of months, and then reduce it every month after that.
Repeat that for every test that you completed within the time period you’re interested in and add it all up.
The tricky part is taking into account the timing of when the change from each experiment is shipped and putting together a chart that shows the impact from individual tests stacking on top of each other and declining over time to show the cumulative impact for any particular date range in the future. The basic calculation will just spit out a number, and the time needed to fully realize that impact depends on how long you hold the effect steady and how much you reduce it every month.
If you want a nice graph that looks like this, you’ll need to put in more work, or use a tool that does it for you:
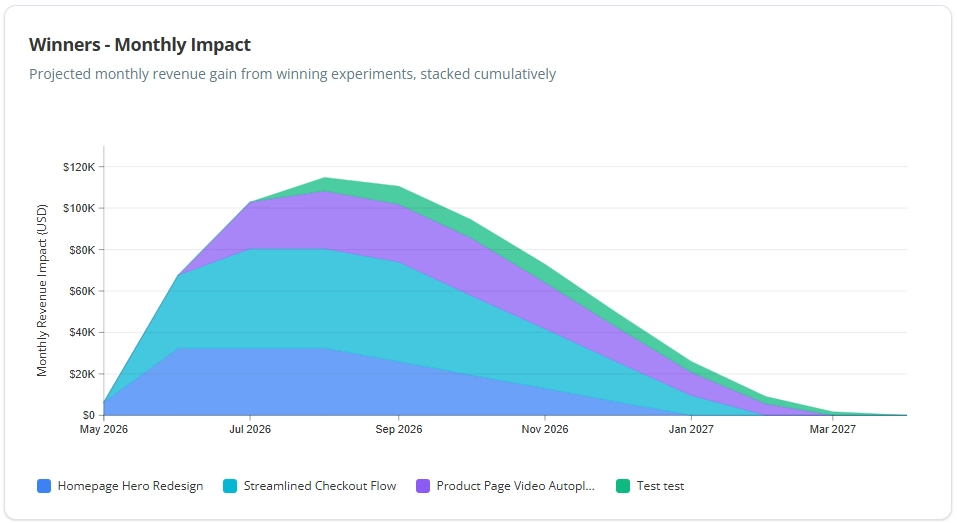
We’ll be using Katsed, our experimentation analytics tool that has revenue impact reporting built in. You don’t need a Katsed account to use it, unless you get tired of entering experiments manually or want to save your work and collaborate with your team on the reports.
Here’s the step by step:
1. Go to https://katsed.com/tools/revenue-impact/ and enter your email to get access
2. When you first get there, it will be pre-loaded with some sample experiments so that you can see how everything works with data in there already:
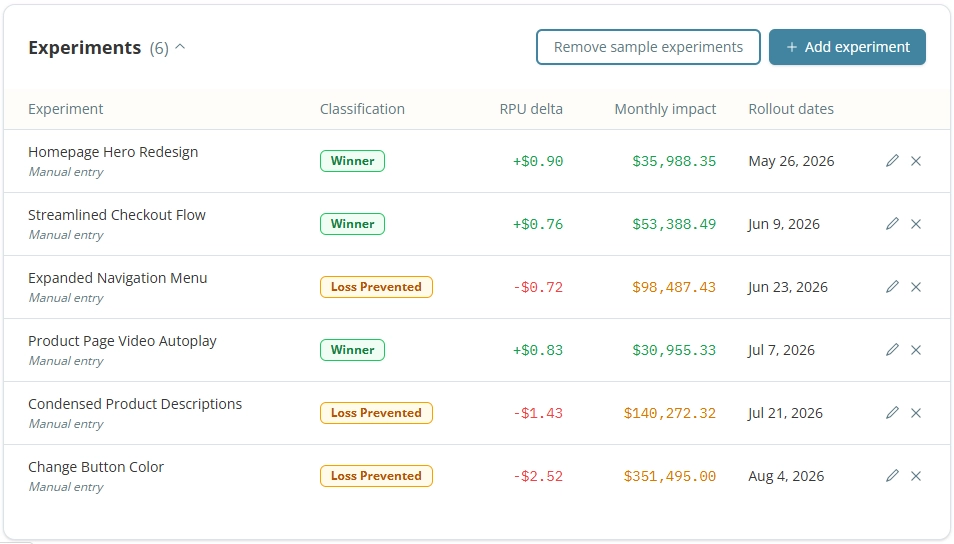
3. Click “Remove sample experiments” at any time to clear those out. You can do it right away, or wait until you’ve added some of your own.
4. Click “+ Add experiment” and you’ll see the form with the details you need to enter:
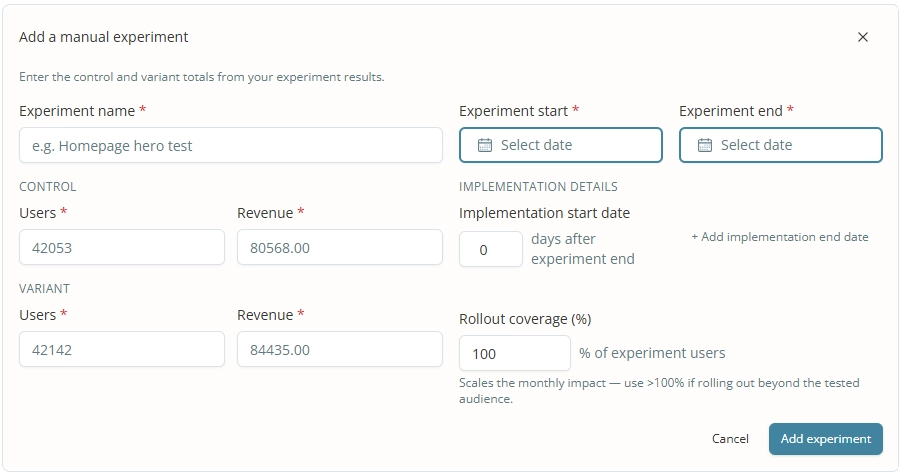
5. Enter the test name, users and revenue for both control and variant, and the experiment start and end dates.
6. Optionally, you can specify a delay between when the experiment concluded and when the change was or will be implemented on the site. And if, for some reason, the change will only be live for a certain amount of time, like for a seasonal promotion, you can specify an end date as well.
7. You can also change the rollout coverage. This represents the relationship between the users that were targeted in the test and the users that will actually see the change once it’s live on the site. In most cases, this should be 100%, but say you tested the change on a single product page but will be implementing it on all product pages together, which have 5x the traffic of the single page, you would increase that to 500%. Or, if you’ll be rolling out the change to only a segment of users, you could decrease it below 100%.
8. Once you click “Add experiment”, the details will be added to the experiment list:

9. Each test will be automatically classified as “Winner” or “Loss Prevented” depending on the direction of the RPU change:
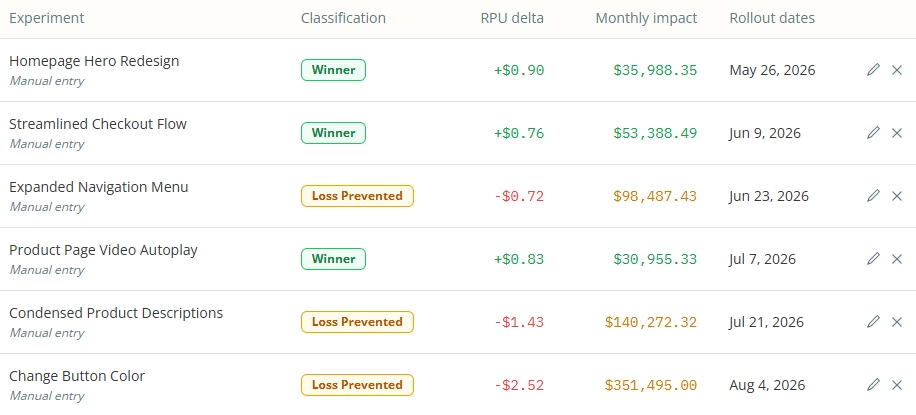
10. You can edit, remove, or add experiments as needed until your list is complete. The charts will be updated as you go, and everything will be compiled into the Revenue Summary section, where you can choose how far forward to project the impact. The start date for the projection defaults to the earliest implementation date of the experiments in the list:
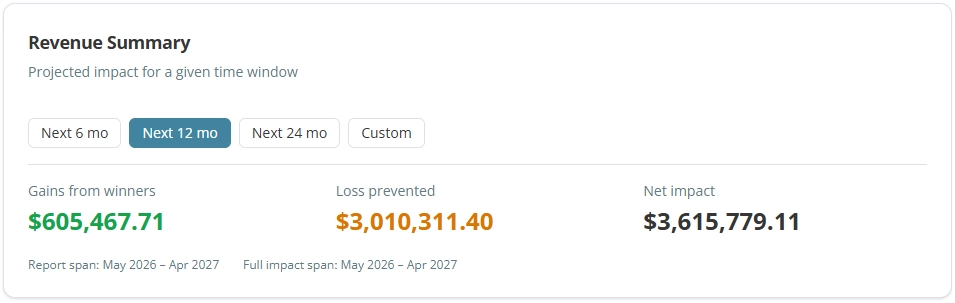
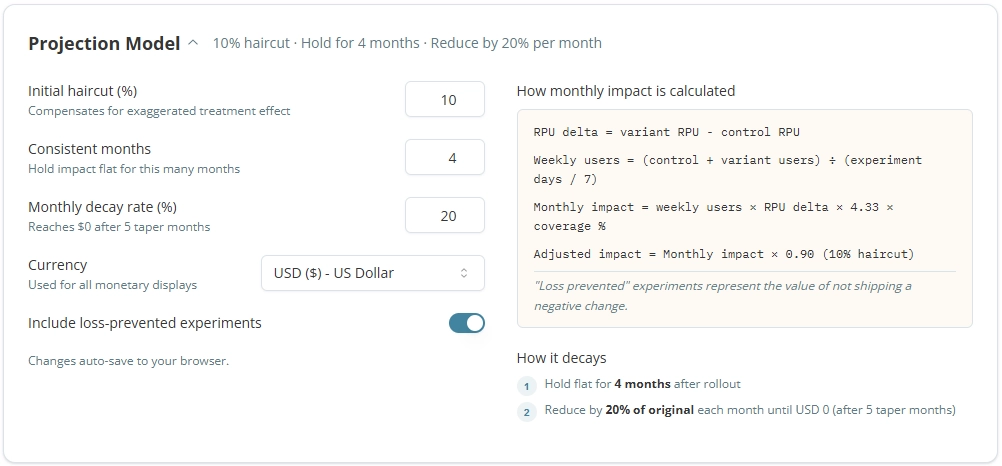
11. If you’re ok with the defaults of a 10% haircut, holding the impact steady for 4 months and then reducing it by 20% per month, you’re good to go. But of course, you can customize this in the Projection Model section at the bottom, where you can also choose your currency and toggle whether to include loss-prevented experiments or only show winners:
That’s it! Once you go through these steps, you’ll have everything you need to let your stakeholders know the value of your testing program:
- All of the experiments you ran during the time period
- The increase in revenue that each winning experiment will provide
- The losses you saved from testing and not shipping changes from each experiment that lost
- Graphs showing the impact that individual and combined experiments will have over time
- The total revenue impact from all of the experiments, broken into winners and prevented losses
How does this tie in with ROI?
This article is focused on the revenue side of the equation, but it’s a simple step to compare this to the investment side. This will vary quite a bit depending on your context. If you’re an agency or freelancer reporting ROI to a client, then the investment is basically your fees and the cost of the A/B testing tool and other tools. For an internal program, you might want to take into account the salaries of the experimentation team, the proportion of the engineering team’s capacity that is used for building A/B tests and implementing the changes, and whatever else makes sense to isolate as being a cost of the testing program itself.
Once you’ve decided on which costs to take into account, add them up for the time period between when the first and last experiments in the list were concluded. You could make the case from starting with the starting date of the first experiment, but presumably this is an ongoing program and most experiments were started during the end of the window that hadn’t completed yet, so it’s more accurate to go with either start dates or end dates, and not combine them.
Conclusion
Forecasting revenue isn’t an exact science, but that’s ok. Nobody is expecting you to have a crystal ball, and as long as you state the assumptions that your model is based on and you take care of the quality of experiments that go into it, this is a perfectly reasonable way to translate the effects from properly run experiments into potential dollars that those experiments are contributing to the bottom line.


Written By
Ryan Thomas
Edited By
Carmen Apostu