Author

Trina Moitra is the head of marketing at Convert.
The Marketer’s Guide to CRO By Trina Moitra:
- What Is Conversion Rate Optimization?
- What Is Conversion Rate?
- How to Do Conversion Rate Optimization? A 3-Step Framework
-
Conversion Rate Optimization (CRO) & Privacy
- Step 1: Designate a Data Privacy Specialist
- Step 2: Train Your Team on Privacy Procedures
- Step 3: Update Your Privacy Policy
- Step 4: Build a Flow for Processing Requests for Consumers’ Personal Data
- Step 5: Allow Users to Opt-Out of Selling Their Personal Information
- Step 6: Update Client Contracts to Comply with Data Privacy
- Step 7: Get Consent from Minors Before Selling Their Information
- The Bottom Line
-
Common CRO Mistakes That Need to Stop in 2021
- Conversion Rate Optimization is only about conversion rate optimization.
- A/B Testing is the same as Conversion Rate Optimization.
- Conversion Rate Optimization is an after-thought.
- Conversion Rate Optimization is all about tools.
- Conversion Rate Optimization is at odds with Search Engine Optimization.
- A Comprehensive List of Conversion Rate Optimization Tools
- Conversion Rate Optimization FAQs
What Is Conversion Rate Optimization?
Conversion Rate Optimization (popularly known as CRO) is a discipline that uses data-driven frameworks of evaluation, analysis, and frequently A/B testing, to remove obstacles from an online property — like a landing page, a form, or even an e-store — so that more of the visitors who come to these assets end up taking the desired action.
When a prospect takes the desired action, they are considered to be “converted”. Some examples of goals that can be improved through Conversion Optimization drives are:
- Increased form completions
- Increased page scroll depth (indicating increased engagement)
- Reduced page bounce rate (indicating increased engagement)
- Increased add to cart percentages
- Increased purchase completions
- Increased downloads of a PDF or gated free resource
- Increased page views
- Advanced objectives like the increased likelihood of taking an action (like completing a purchase), but only for certain audience segments (like those who visit the site from paid ads).
How conversion rate optimization works is it attempts to plug the potential revenue/conversion leaks on a site to increase its profitability, as opposed to driving more visitors to a site that has unresolved resistance points.
While simply increasing ad spend and bringing more people to an unoptimized page may seem quicker and easier, Conversion Rate Optimization (or CRO) offers a higher return on investment over time because improving the site experience can lead to customers spending up to 140% more on a brand.
Moreover, there is an interesting correlation between optimizing a site for conversions and the revenue generated by it. Research at Forrester has found that some brands display an exponential relationship between improving CX and revenue. These companies should focus on offering exceptional customer experiences on an ongoing basis — even to those who are already pretty happy.
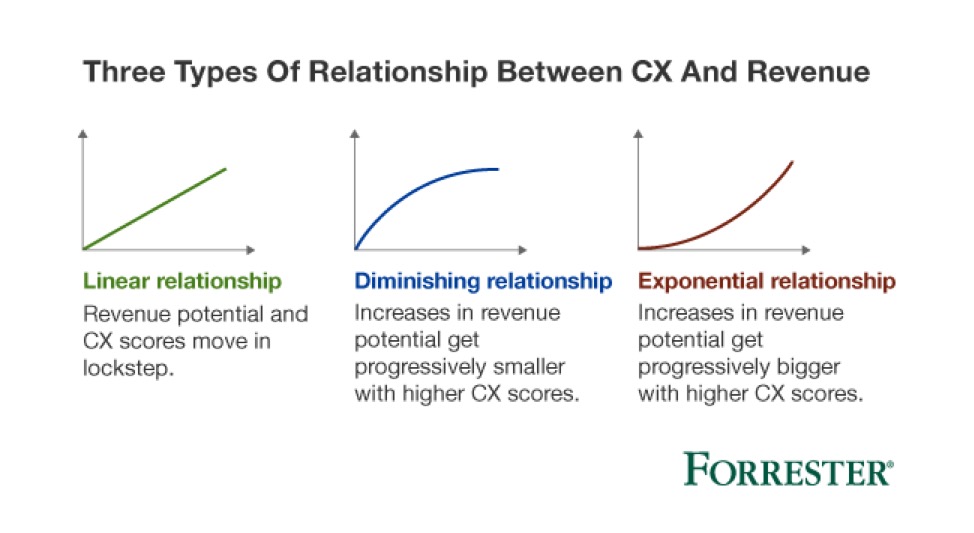
When initial pain points and instances of poor site design are eliminated, the immediate impact is negligible. However, with time, the cumulative growth is significant and even small changes can lead to noticeable upticks in conversions, and thus profits.
If you are contemplating investing in Conversion Rate Optimization, the journey will be interesting, challenging, and rewarding.
What Is Conversion Rate?
Before we dive into the definition of conversion rate, let us refresh the concept of conversion. When as a marketer you build a landing page or write an email, you have a goal in mind. An intention that sets the tone for the copy, the design, and the CTAs.
When someone takes this desired action — they convert. And are logged in your analytics systems (Google Analytics/email analytics/landing page analytics) as a “conversion”.
The good news is you have the flexibility to define any desired action or end goal as a conversion.
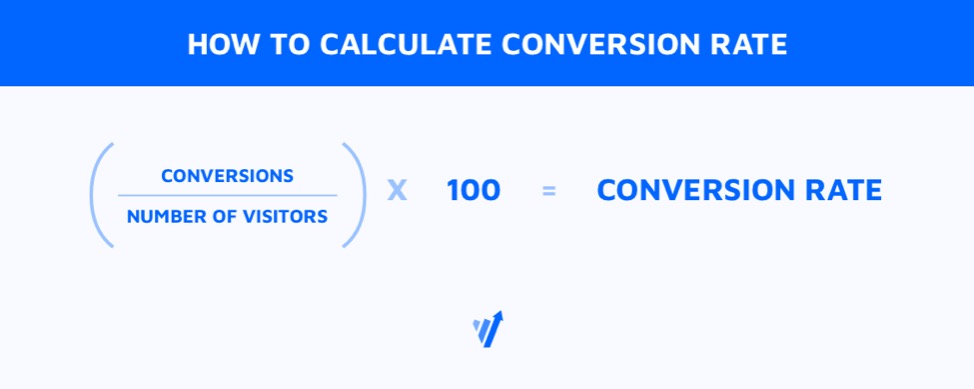
Conversion rate is the ratio between the total number of unique visits with successful conversions and the total number of visitors to the page or the site (irrespective of whether they take conversion actions or not).
Like most metrics, the conversion rate on its own can’t tell you much about the performance of your landing pages, your emails, or other assets. You need two additional data points to make complete sense:
- The industry baseline. How does your landing page stack up against the pages of your competitors?
- The cost of each conversion. Also known as the Cost of Acquisition. How much did each conversion cost you?
If your landing page out-performs every other page in the space, yet you are still shelling out more money to convert prospects than you make from their conversions, you will not be profitable.
Thus, conversion rate together with baseline numbers and cost of acquisition can guide you toward changes you need to make and where you can get started for maximum impact.
The Different Types of Conversion Rates
Conversions also benefit from a back-up plan.
While the concept of conversion rate is simple in terms of math, there is a lot to unpack here.
Conversion rates can be further sliced and diced to focus on the conversion percentage for particular user segments.
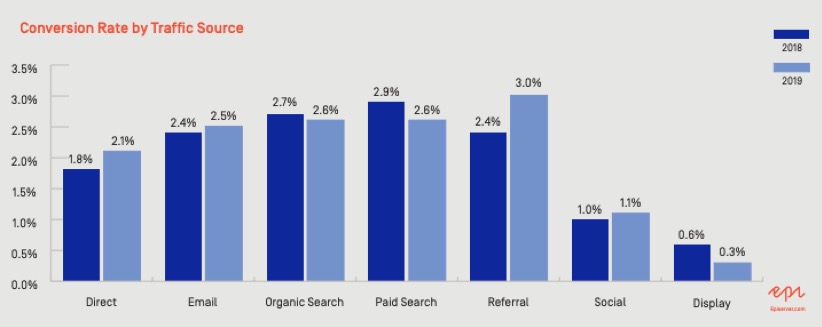
For example, a recent E-commerce benchmark report by Smart Insights reveals how online stores perform for micro-segments like users who visit the sites from Google versus visitors who find the site through PPC (source-based segmentation). You can also explore performance by device and grouping of marketing channels — omni-channel vs. single-channel.
Conversions can further be classified as macro and micro conversions.
Macro Conversions
These are conversions for the primary goal of the site, the landing page, or the email. These conversions justify the effort invested in the optimization drive. For an e-store, this would be purchases completed. Or transactions made.
Micro Conversions
These are conversions for the supporting goal. So why do you need micro-conversions? They are a reporting back-up plan. And a way to further tune out the noise from performance data. Often, despite best efforts, there might not be a positive change in the macro conversion rate.
Under such circumstances, a positive shift in the micro-conversion rate (especially if the micro goals are supporting the macro-goal) can signal that the optimization efforts are at least in the right direction.
Conversion Rate Optimization can benefit greatly from a clear understanding of Leading Metrics and Lagging Metrics for the improvement you are trying to make.
Leading Metrics can be impacted through action or effort. Lagging metrics simply measure or evaluate the output of the Leading Metrics.
What’s Lagging for a particular optimization project can in fact be Leading for future experimentation drives.
If you are trying to improve how your site forms convert, drop-offs between screens is a Leading Metric. But the actual Abandonment Rate for the form is a Lagging Metric.
Conversion Rate & Google Analytics
Google Analytics is the weapon of choice for most marketers. Here is a breakdown of how you can start tracking conversion rates for your website and landing pages.
- Decide on what qualifies as a conversion. If you are aiming to have more people fill out a form — there are a few ways in which “success” can be logged for this goal. You can either choose to display a thank you page on form submission. Or if a thank-you page is not possible, then you can depend on the click on the SUBMIT button. You may also take the display of a custom in-form success message as the trigger to count a conversion.
- Choose the type of Google Analytics goal that best meets your needs. You can opt for a destination based goal, a duration goal, or an event — which in conjunction with Google Tag Manager allows you to track most on-page engagements. As a rule of thumb, a destination goal is the preferred way to count a macro conversion, while custom events are great for micro conversions.
- Set up the goal. And assign a value to it. For E-commerce stores, if the goal is purchases, setting a value is easy. It simply corresponds to the selling price of the product. For other industries like SaaS, the conversion rate between leads and MQLs, then MQLs and SQLs, can offer some insight into how much a free trial conversion can be worth to the company (the Lifetime Value of customers).
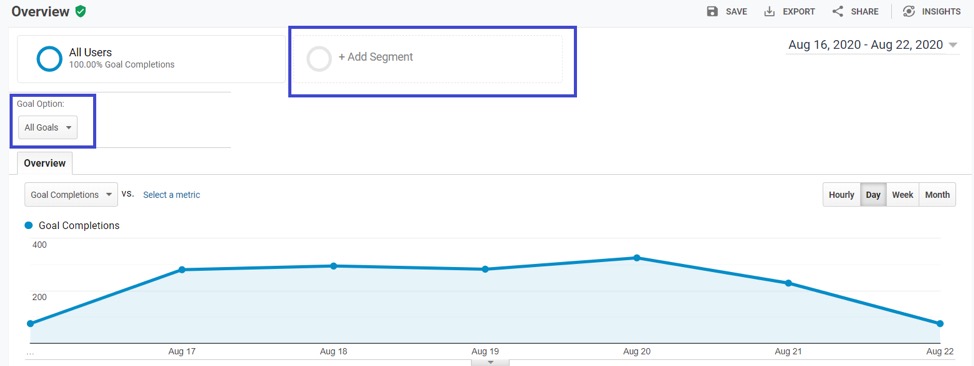
- Choose the mode of conversion rate analysis. You can analyze the conversion rate (or goal completion rate) per goal on your site. Or you can segment your audience based on custom conditions and then evaluate the performance of your macro and micro goals.
Conversion Rate & A/B Testing
A/B testing focuses on optimizing a site for conversion rates.
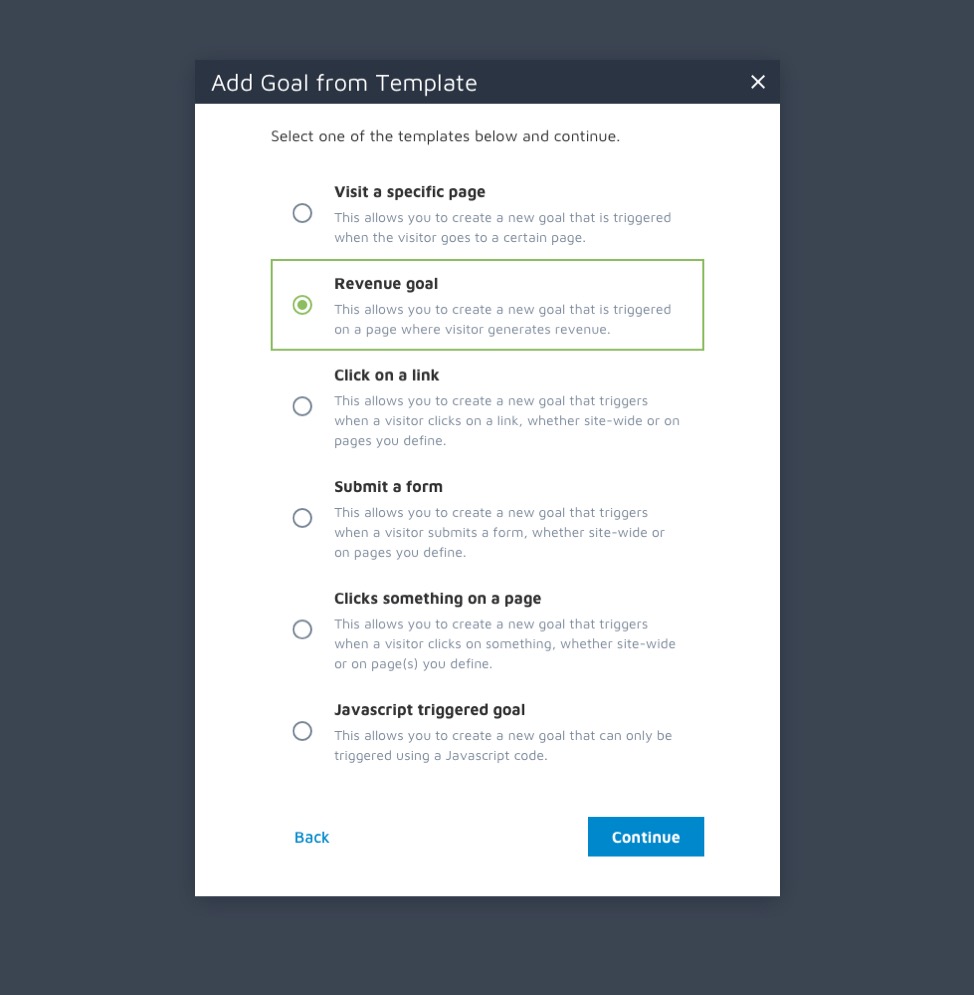
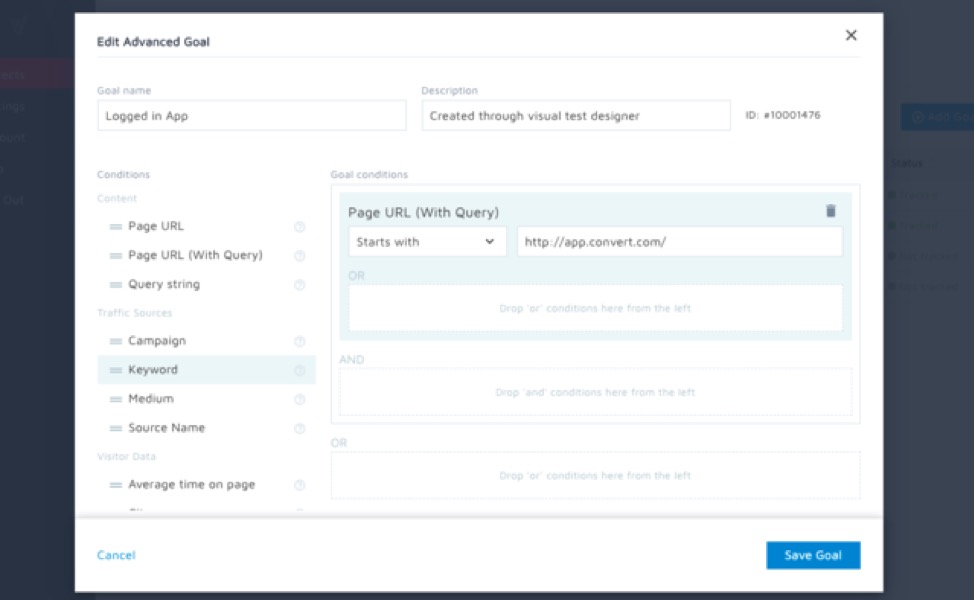
There is considerable emphasis on goals. But not all A/B testing tools are made equal. Some offer only bare-bones goal tracking in low tier plans, reserving the custom goal templates for higher-paying users.
But this defeats the purpose of conversion rate optimization… because, at the end of the day, it is about conversion rates.
Convert Experiences — for example — offers 9 goal templates. Plus 40+ conditions that can be stacked to define advanced goals. This rich variety allows for macro and micro conversion rate tracking, all from the experiment summary dashboard.
Looking for an A/B Testing Tool That Will Make Conversion Tracking Easy?
Give Convert Experiences a try.
How to Do Conversion Rate Optimization? A 3-Step Framework
According to WordStream, the average conversion rate of a website is a low 2.5%. What you invest in various marketing drives to bring people to your online brand and presence fails to deliver returns for almost 97% of the footfall.
When you look at the cost, the effort expended, and the output, it just makes sense to fix what is off with your site, your landing page, or your other assets, before scaling lead generation.
Conversion Rate Optimization is an exploratory process. No conversion strategy guarantees a win.
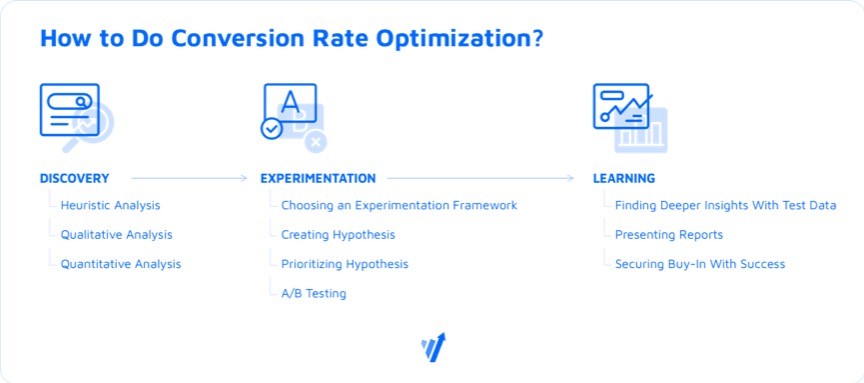
In a rapidly changing, complex ecosystem that is your brand, as with everything else, CRO also involves three key steps — Discovery, Experimentation, & Learning — for long-term and consistent improvement.
In short, you have an idea of what might be wrong and what might work instead, based on quality data. But the actual right solution can only “emerge” from your experiments.
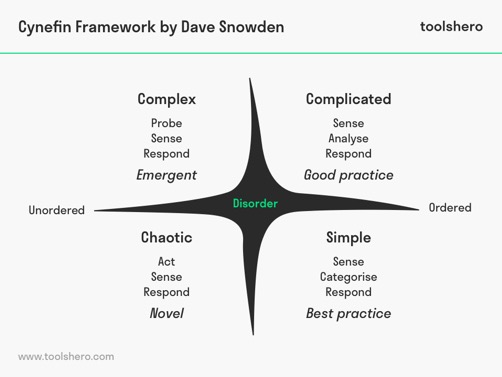
Want to get Better at Creating a Cohesive Conversion Rate Optimization Strategy?
The Cynefin Framework can help.
Discovery
The first stage is Discovery.
As the name suggests, this is the time to suspend judgment, ego, what you think you know is right, and let data point the way.
An analysis or a probe is as good as the data underlying it. So make sure you collect clean and quality data and allow it to tell you the story.
There are 5 different types of data your discovery phase may yield, but for the sake of simplicity, they can be clubbed under the banners of Qualitative and Quantitative.
| QUANTITATIVE DATA IN CRO | QUALITATIVE DATA IN CRO |
|---|---|
| Start here. This is because quantitative data leaves little room for misinterpretation. If you are starting out with conversion optimization, having concrete stakes in the ground as “facts” is extremely important. | Once the quantitative data gathering is done, you can shift your focus to the qualitative realm. This is still better than going by gut instinct or the dreaded HiPPO. However, qualitative data asks you to interpret the findings. And there is a chance for bias to creep in. |
| Quantitative data is a precise, unequivocal metric that can be pulled from an analytics engine like Google Analytics, Mixpanel, or Amplitude. Some examples of quantitative data are Pages viewed/session, the bounce rate of a page, or the total number of conversions. | Qualitative data is generalized. It is subjective. When you conduct focus group interviews, when you place surveys and polls on your site, when you look at user session recordings — you are collecting qualitative data. Hotjar is one of the most popular qualitative data collection tools out there. |
| Quantitative data tells you the “WHAT”. What aspect of your site or your landing page is broken? If the bounce rate is particularly high for a blog page but the scroll depth is decent — there is something off with the way that page is structured. | Qualitative data tells you the “WHY?” Why is the aspect signaled by quantitative data broken? Building on the example of the blog page, you may launch a poll on it to understand why people are bouncing away — despite finding the content engaging. |
| A blog should ideally invite readers to read more and explore the site. Visitors should not be bouncing away as soon as they get the “answer” they were seeking through the content. | The answer you get will not be definitive. Some visitors may indicate that they are students and have no intention of learning more about the brand. They are content with their “answer”. Others may point to poor site linking and the inability to find other interesting pages to peruse. |
| You can’t argue with quantitative data. If data collection is done well, these numbers are undisputed. | You can and should argue with qualitative data. This type of output encourages you to brainstorm, to consider possibilities that were completely off the table. |
Heuristic Analysis for CRO
Heuristics are mental shortcuts that human beings use to make snap decisions. It is looking at past data and trends to identify a good enough course of action to take.
If there were no heuristics, we would forever be stuck in trivial decision-making and squander our mental bandwidth.
So what exactly is a heuristic analysis in Conversion Rate Optimization and how can you leverage it in the Discovery phase?
Heuristic Analysis is taking the lay of your conversion land.
It is often used interchangeably with usability analysis, but the two are different, as is laid out here.
Typically in heuristic analysis, the CRO team identifies a list of 5 to 10 key “tasks” a visitor needs to complete on the website (or the landing page) and undertakes them.
Along the way, experts on the team compare the reality with UX best practices and score how detrimental the issues may be to the end goal of achieving a conversion.
This process is relatively quick and simple. It relies on the expertise and experience of the CRO team and can often point out glaring gaps right away.
Things that are broken and must be fixed.
You might say that Heuristic Analysis scores how your site stacks up against the wisdom of thought leaders and industry experts.
But that does not mean there can’t be a framework around it.
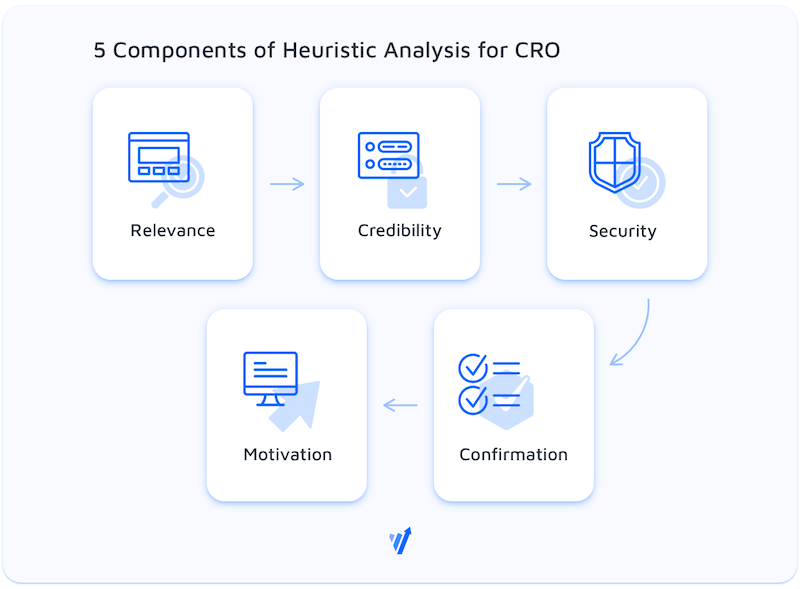
One of the best ones in recent times comes from CXL.com. It focuses on the following factors:
- Relevance
- Does the content match up well with the intention of the visitor? If you display Decision phase content and CTAs to an Awareness phase crowd, the conversion rate is bound to be low.
- Does the content match up well with the intention of the visitor? If you display Decision phase content and CTAs to an Awareness phase crowd, the conversion rate is bound to be low.
- Is the site navigation consistently encouraging visitors to progress along their buyer’s journey? Or is it pointing them to random resources that don’t make sense in the scheme of things?
- Is the site delivering on what was promised in the previous touchpoint? This is particularly important for visitors from paid traffic channels. A mismatch or lack of coupling here can derail conversions.
- Does the content match up well with the intention of the visitor? If you display Decision phase content and CTAs to an Awareness phase crowd, the conversion rate is bound to be low.
The bond that exists between the pre-click experience and the corresponding post-click landing experience. Conversion coupling means maintaining consistent messaging throughout your campaign.
Unbounce
- Credibility & Security
- Does your site have a proper, valid security certificate? LinkedIn is rife with complaints from users who are greeted by security certificate expiry messages for sensitive data like bank entries! Financial institutes are held to higher standards than other websites, but no matter what your end goal is, if you are handling user data, you have to be careful.
- Do you display customer logos, testimonials, and case studies to further demonstrate how other businesses and individuals have benefited from trusting you?
- Does your site use encryption?
- Have you made it clear that you are privacy compliant?
- Are your terms of use clear? Is the privacy policy professionally written up? Are you telling your visitors exactly what cookies you’ll be using, and how you will be processing the data collected?
- Does your site have a proper, valid security certificate? LinkedIn is rife with complaints from users who are greeted by security certificate expiry messages for sensitive data like bank entries! Financial institutes are held to higher standards than other websites, but no matter what your end goal is, if you are handling user data, you have to be careful.
Our Premium Agency Partner, Conversion Rate Experts, has compiled an in-depth guide on site elements that signal credibility. It will help you go beyond reviews & testimonials to explore the possibility of other trust indicators your competitors are missing out on.
- Motivation
- Does your hero structure clearly explain your unique value proposition?
- Is there content supporting your claim in the hero section with data and logical arguments?
- Have you simply listed out features, or have you dug deeper to highlight how these features offer benefits that can turn into a competitive advantage for your visitors? Unless this loop is closed, you will continue to drip conversions.
- The other side of the motivation coin is reducing friction and distractions. Is your site free from confusing call-to-action paths?
- Are the secondary CTAs, to some extent, supporting the primary goal?
- Is there enough contrast on the call-to-action buttons?
- Is the CTA copy highlighting a core benefit, or is it something robotic, like “Submit”?
- Are there proper instances of future pacing? It is crucial to highlight the gap between where prospects are and where they can be!
- Is there ambiguity around what will happen if visitors click a particular button or take an action? This may be anxiety-inducing.
- Does your hero structure clearly explain your unique value proposition?
The MECLABS Landing Page optimization formula is C = 4M +3V + 2(I-F) – 2A.
where
C = Probability of Conversion
M = Motivation
V = Value Proposition
I = Incentive
F = Friction
A = Anxiety
A good, in-depth heuristic analysis would look at accepted best practices for all of the elements.
- Confirmation
- Do you have thank-you pages that reinforce the validity and benefit of the action taken?
- Once the prospect has been convinced, is there content, or are there site elements that may potentially re-introduce doubt?
- Do you have thank-you pages that reinforce the validity and benefit of the action taken?
Optimizing for after the conversion is equally valuable. It improves the UX of the entire buyer’s journey and ultimately increases the Lifetime Value of the customer.
OUTPUT OF HEURISTIC ANALYSIS:
● Red Flags
● Elements to Fix Right Away
Quantitative Analysis for CRO
We have been introduced to Quantitative data.
As a marketer, you are already well versed in the platforms that collect these data sets. The skill that you need to acquire is looking at the data from the point of view of an optimizer.
So how can you begin quantitative analysis for conversion rate optimization?
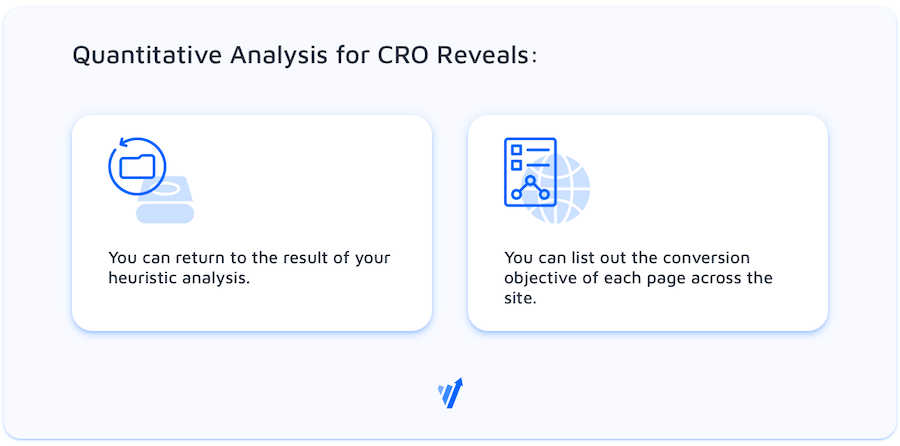
- You can return to the result of your heuristic analysis. If there are suggested best practices that are not being followed along key funnels (like the ones resulting in macro conversions), you can dig out quantitative data to prove (or disprove) the necessity of the tweaks to be made. Always remember though — let the data speak.
If you suspect that the violation of the best practice should lead to (say) fewer clicks on a particular button — take a look at the Events report. How many clicks do other similar buttons get? Is the offending button actually underperforming?
- You can list out the conversion objective of each page across the site, factor in the intention of the traffic that visits the pages, and then start looking into goal data and events data to shed light on exactly what is broken.
With time though, you should develop the habit of tracking key metrics throughout the year, and then it’s a question of crunching your collected data to allow patterns and improvement opportunities to emerge.
Google Analytics For Conversion Rate Optimization Opportunities
Google Analytics can offer both quantitative and qualitative data. But let’s focus on some great reports and hacks that can enrich your drive with quantitative data to optimize your website.
Blog/Content Optimization
Content Marketing — in a world where millions, if not billions of articles, infographics and blogs exist, creating more assets to add to the noise hardly makes sense.
Unless you can tweak your process, learn from the misses, and reliably scale the hits. Conversion Rate Optimization is thankfully a principle that applies to your content as well.
CRO in content marketing focuses on a few things:
- Aligning the content with the intent behind the searched keywords
- Increasing dwell time on the page
- Reducing bounce rate
- Boosting the number of conversions driven by the content
Conversion Optimization for Blogs: Understand the Value of Your Content Marketing?
You can do this in a couple of ways:
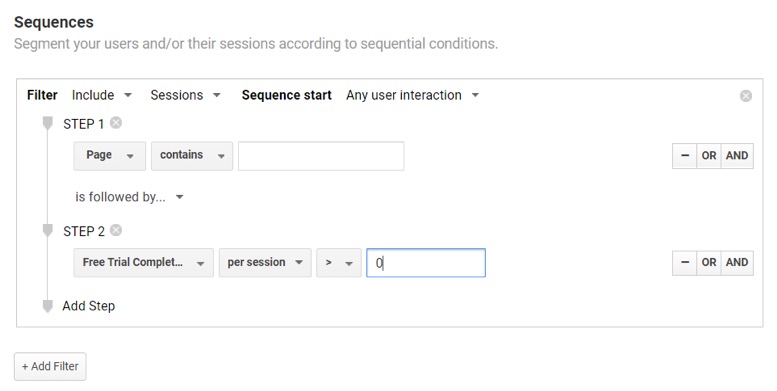
- You can look at the performance of the content (for the sake of convenience, let’s refer to blogs) from the perspective of sessions. So you can create a custom segment of any user who has visited the blog and then converted (you can specify the sequence of events with the “SEQUENCE” option) on your micro/macro goals to get an idea of how many conversions are being nudged by your asset, per session.

- You can look at the performance of the blogs from the perspective of the total number of conversions supported. If you are a B2B organization, or a company where multiple touchpoints are needed before a deal is closed, narrowing the scope to same session conversions is quite limiting. In such cases, you can look at how many micro/macro conversions have been completed by users who engage with the blog at any point in their buyer’s journey.
Do remember that since you’ll be looking at a segment based on Users, you can only access data that considers a 90-day window. - The final factor is known as Page Value. Simply put,
Page Value is the average value of a page that users visit in a session, before completing a conversion. Let’s unpack the implications first.
(i) Page Value is an average. So if a particular page has assisted 5 conversions over 50,000 sessions, the value is going to be quite low.
(ii) Page Value is relative. Since it does not provide the net number of conversions assisted (as we have seen in point #1), you have to look at the baseline Page Value of your blog or your site before commenting on the effectiveness of a particular page.
(iii) You need Goal Values in place before you can work with Page Value.The upside of working with Page Value is the fact that it is easier to pull as compared to creating segments by users or sessions.
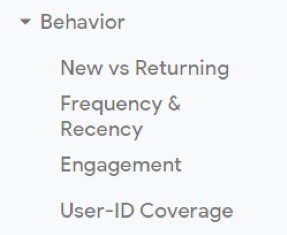
Go to Behavior > Site Content > All Pages. You will see a column titled PAGE VALUE.
By default, this report is set up to report Page Value by the dimension “Page” (URL of the content pages) and is sorted by Page Views. But you can choose a secondary dimension of Page Title and click on the Page Value column to get a list of site pages with high Page Value. You are also provided with the average page value of your site or property. And you can compare how well or how poorly particular blogs are performing.PRO-TIPFilter the All Pages report by the URL of the particular blog or page you want to evaluate.

Once you have a clear understanding of how blogs or content, in general, is performing, you can begin to segment articles by writers or topic to zero in on things that are working for your content strategy in general.
If a blog draws in lots of traffic but is not supporting conversions or has a high abandonment rate for the goal of interest, then you need to focus on finding ways to prove the value of the action you wish readers to take.
Maybe the CTA is not strong enough. Maybe a new heading is needed. And with that, you are already well on your way to optimizing content.
Funnel Optimization
If the content is the net you cast to get on the radar of your prospects, funnels draw them in and qualify them to close.
A business funnel is a well-thought-out sequence of touchpoints that provides value to your ideal customers and motivates them to move from one stage of their buyer’s journey to the next.
A lot needs to align for a funnel to work.
- You have to be top-of-mind for your prospects so they think of you when the need to advance on their journey arises.
- Your touchpoints should work well across the devices your prospects use.
- The content with which you nurture them and the CTAs you use to motivate them should be optimized for intent.
Funnel optimization is a step-by-step process. Here are a handful of data sets from Google Analytics to guide you in the right direction.
- Retargeting Optimization: Do you have site retargeting in place? You absolutely should. Make sure you use the right UTM parameters in your retargeting ads and can create custom segments by source within Google Analytics.
Once this is done, explore how retargeted prospects are using your site. Navigate to the familiar All Pages report under Behavior. You can look at Technology & Behavior under Audiences to understand how many sessions retargeted visitors are initiating from and what devices they are using. This is valuable information.

Leverage Cohort Analysis for your retargeted segment to determine the cadence of your ads. Lots of action being taken on the 3rd and 4th days since the first visit? Maybe you can have a stronger CTA on your ads to match this behavior. Or reserve these days to make the big asks. - Multi-Channel Experience Optimization: There is a lot to multi-channel experience optimization. But to start, you can segment audiences by the devices they use and dig deeper into bounce rates and site interactions.
Conversion Fanatics CEO Justin Christianson talks about omni-channel experimentation in this short video. - Goal Funnel Optimization: Last but certainly not least, Google Analytics offers something called Funnel Visualization. It lets you see where people drop off or drop out of your well-constructed funnels.
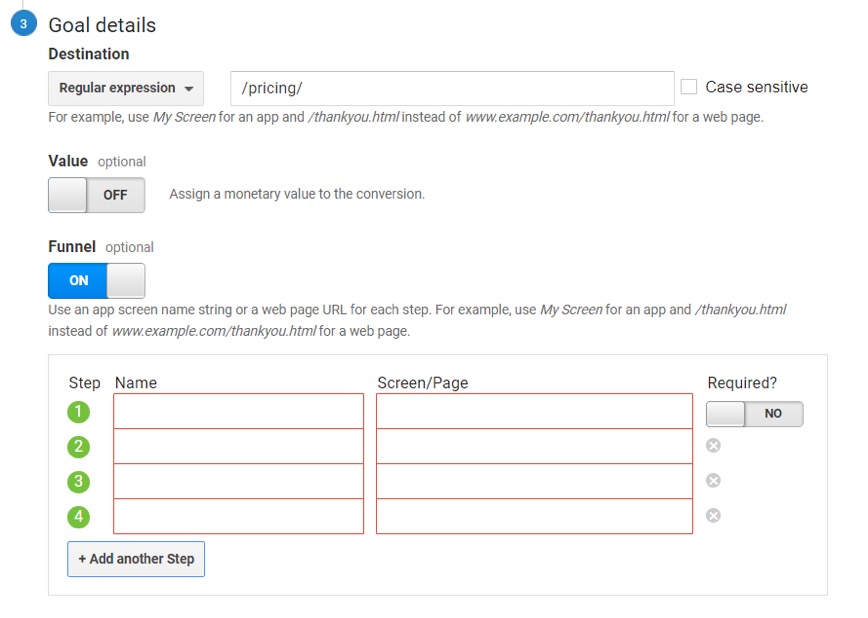
To glean insights, you have to keep in mind two things:
(i) Goal Funnels only work with destination goals.
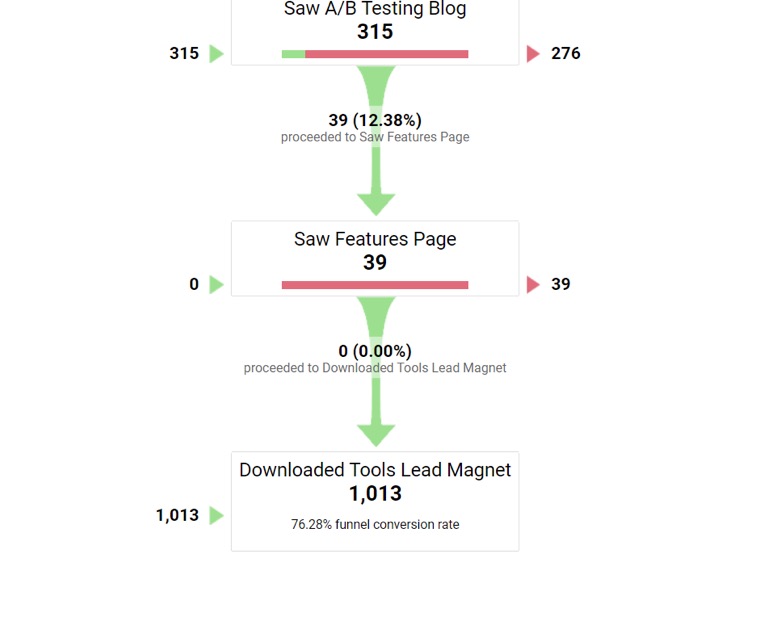
(ii) When you are setting up a destination goal to be triggered on the visit of a thank-you page, you must input all the pages in the sequence that a user is expected to visit when moving through the funnel. Once this is done, you can click on “Funnel Visualization” under Goals, choose the destination goal you wish to analyze, and see something very similar to the image below.
 Interpreting a Funnel visualization report is simple:
- Each stage of the funnel has a conversion percentage. This is the net number of prospects or leads that moved on to the next step of the sequence defined when you set up the destination goal.
- When there is an abnormally large number of people leaving the funnel, that’s a clear indication of something broken in the finer details.
- Even though not strictly quantitative, the net conversion percentage for the funnel (the total number of people who complete the funnel/the total number of people who entered it) can point your website optimization efforts in the right direction. If the net conversion percentage is decent and the total number of prospects dropped into the funnel is low, then maybe it is time to focus on a different sort of optimization — search engine optimization (SEO) to attract higher volumes of better quality leads.
- Each stage of the funnel has a conversion percentage. This is the net number of prospects or leads that moved on to the next step of the sequence defined when you set up the destination goal.

Form Optimization
The combination of goals, events, and custom segments can allow marketers to get good baseline quantitative data to begin form optimization.
Here is a step-by-step process to gather data to optimize the forms on your website:
- Identify the form you want to start with. It can be your best lead form. SaaS companies can look at their free trial and demo forms. Publishing sites can focus on their newsletter forms.
- Calculate the conversion rate for the form. This is the total number of people who load the form divided by the number of people who view the thank-you page or the success message. As already discussed, an event-based goal can be triggered on form load and a destination goal can capture form completion.
- Slice this data by device for laggards. With the rise of mobile-first interactions and omni-channel marketing, simply looking at a broad swathe of data around cumulative conversion numbers is not enough. Use standard Google Analytics segments already available to you and investigate how prospects on various devices interact with your form. You may find that those who use tablets pull down the conversion percentage. This is a good starting point.
- Let quantitative data paint a qualitative picture. We have already talked about the fact that qualitative data needs interpretation and is largely subjective. Why not inject some cold numbers logic into the mix?
Once you move to qualitative form analysis, you are likely going to leverage both heat maps and session recordings and maybe even user-testing to get a good idea of why prospects abandon your form. Having a bit of confirmation from your Google Analytics metrics is a safety net.
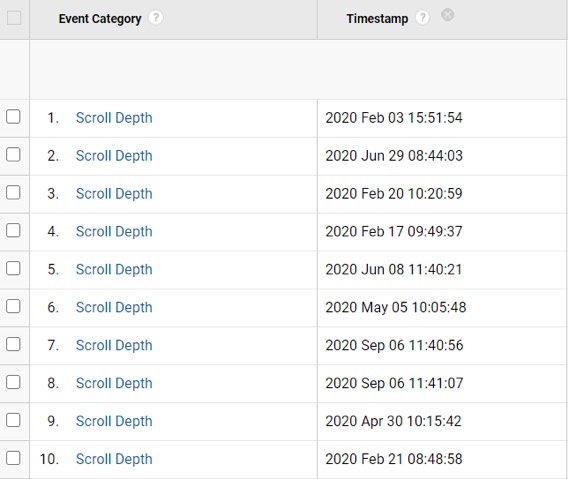
If your lead form is progressive and there are multiple submit buttons, you can capture clicks on them, with the custom dimension of a timestamp, to understand how prospects interact with them as they fill out the fields. Sudden drop-offs after the first submission can indicate a hesitance to fill out the remaining fields.
Custom Dimension Timestamp
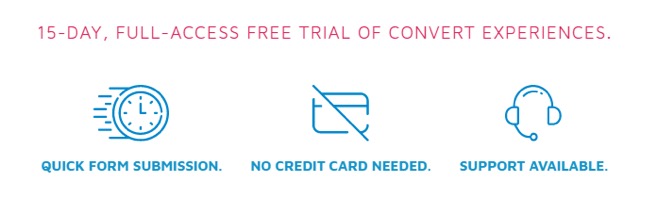
Studies around conversion rate by the number of form fields have shown that context is extremely important. Motivated leads might be deterred by form micro-copy. Awareness stage prospects may look for the easiest way to finish a sign-up because the desire to complete the action is not strong enough.
Example of Form Micro-copy
The information you collect over the four steps is a patchwork and the gaps can be filled in through qualitative analysis.
Of course, if you are using dedicated form analytics tools like Zuko, Woopra, or ClickTale, you will be able to mine more precise insights.
What Ambitious Ideas do you Want to Test Today?
Convert Experiences allows you to integrate with 100+ of your favorite tools on all its plans.
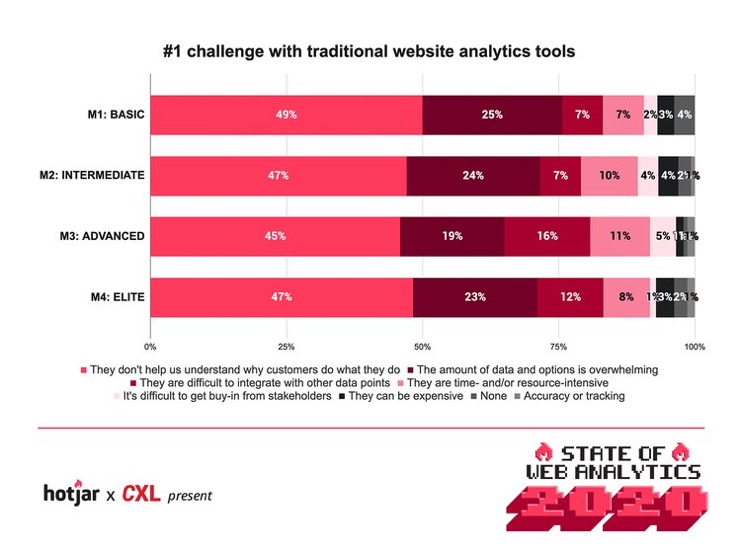
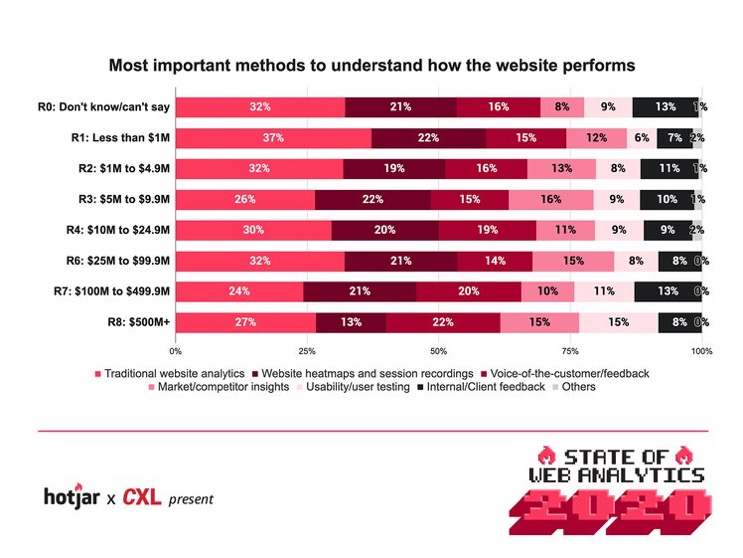
In the latest State of Web Analytics report by HotJar, the biggest issue optimizers face with mostly quantitative data is why customers behave the way they do on websites.
This is followed by the overwhelm of the data options and filters.
As already discussed, qualitative analysis mitigates these issues to a certain extent.
Qualitative Analysis for CRO
Have Lots of Data But Don’t Know How to Get Insights?
We Have a Guide to Convert Numbers into Learning.
Qualitative data is different from quantitative data in two ways:
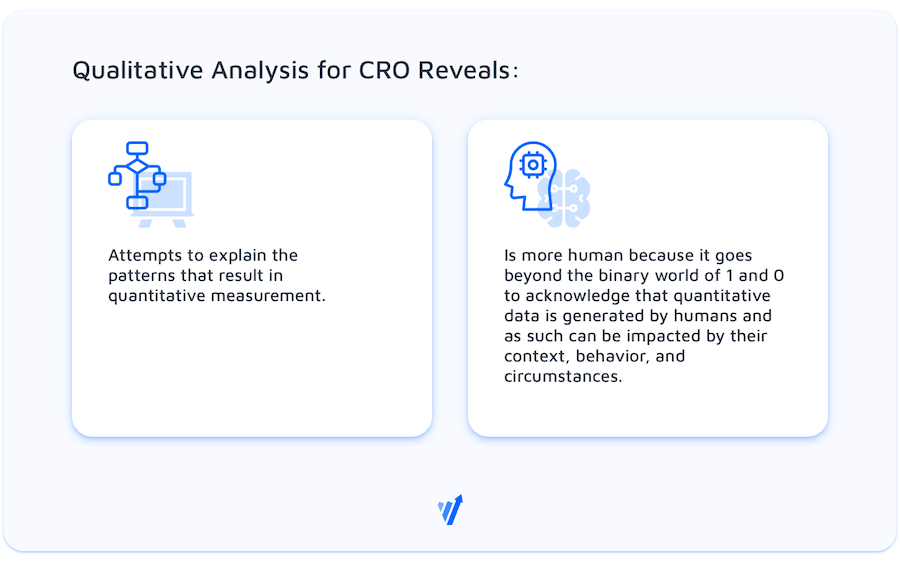
- Qualitative data attempts to explain the patterns that result in quantitative measurement.
- Qualitative data is more human because it goes beyond the binary world of 1 and 0 to acknowledge that quantitative data is generated by humans and as such can be impacted by their context, behavior, and circumstances.
If qualitative data and the insights you extract from it point you in the direction of something broken on your website or in your funnels, qualitative data can reveal why it is broken and help come up with a solution.
Top 5 Ways to Gather Qualitative Data for Conversion Rate Optimization (CRO)
Heat Maps
Love infographics?
Visuals convey vast volumes of data in an easy to grasp way. Heat maps leverage the same principle, allowing conversion-focused marketers to understand how users interact with the elements on a page (including the copy) by tracking the aggregate of their clicks, scrolls, and mouse pauses.
Tools like HotJar have become synonymous with heat maps. Heat maps are useful and they lower the barrier of entry into the complex and subjective world of qualitative data gathering and analysis.
A heat map works in the background, quietly collecting data and presenting it in a format that’s easy to interpret. This is one qualitative data channel that is almost as definitive as quantitative metrics.
Here is an example of a typical heat map:

- The areas corresponding to “hot” — as in red and yellow — show concentration of user activity.
- If you are reading a Move Map or a map that tracks where the mouse of a user tends to pause, then the warmer hues are an indication of eye movement.
- If you are using a Click Map, then warmer regions are the elements that have been clicked on the most.
- If you are using a Scroll Map then red and orange patches stand for the extent to which the page has been scrolled or read by visitors.
Heat maps provide aggregated data.
They reveal patterns of engagement among your site visitors from the sample that is tracked.
USING HEAT MAP DATA:
- Are your site buttons “cold” instead of “hot”? You may want to look into optimizing the contrast of the button or experiment with better micro-copy on the CTA.
- Are prospects not scrolling enough to see your primary Call-to-Action? Run an A/B test with a variant that has a stronger hero section and a more prominent CTA positioned early on.
- Do you get lots of clicks on a badge, but the badge does not lead anywhere? Consider linking it to the next logical step of your prospect’s journey. Remember, the goal in most cases is not to train user behavior, but to improve the on-site experience and make it conform to user expectations.
The rule of thumb is to:
- Read the maps objectively.
- Identify the concentration of clicks and/or activity.
- Analyze if this is what you want.
- Come up with a hypothesis that will better align relevant site goals with user expectations/behavior.
- Test to reveal the truth.
The main reason why people working with data often feel overwhelmed is the lack of context. You’ve got the numbers and you can turn them into complex reports and visualizations but what does it all mean and how do you make it actionable?
Silver Ringvee, Chief Technology Officer @ CXL Agency (via HotJar report)
User Testing
User testing or user research is defined as tasking real people with defined (specific) actions or jobs they must complete on your website in a moderated (observed) or unmoderated (unobserved) setting.
Most of the high ticket, elite companies in the world invest in user testing in some form or the other.
In a typical user testing experiment, the following happens:
- 5 to 10 testers who fit the profile of your ideal buyer or prospect are recruited. You can recruit these individuals on your own or you can task the research agency or the user testing tool you’re leveraging to find them. Bear in mind that the candidates you recruit must meet the criteria of Demographic-Familiarity-Intent.
- A series of jobs or tasks that people need to finish on your site or your landing page to complete your micro/macro conversion is specified. A good example of this may be all the steps that visitors need to go through to purchase a particular product or complete a free trial registration.
Experts recommend mixing up these tasks with unrelated activities to ensure that the mindset mimics that of a regular site visitor, instead of a focused experiment participant.
- The recruited testers go through the task list in a moderated or unmoderated setting. In a moderated setting they know they are being observed by a moderator. In an unmoderated setting, each tester is in his/her own environment and can speak their thoughts out loud as they finish the jobs.
- The recordings of these sessions are shared with conversion-focused marketers who can then extract insights from them.
USING USER TESTING DATA:
- First and foremost, focus on the actions people take, not their impression of how easy or complex a particular workflow is! Subjective opinions are not worth much, since these will essentially come from one person. The sample size is not large enough. Actions speak louder than words, even in this instance.
- In transactions involving money, bear in mind that testers do not have enough skin in the game. Their behavior can’t replicate that of an actual buyer unless the experiment has been set up to introduce incentives involving similar motivations as buying.
- Look for the “WHY”, not the solution. Remember that a flaw observed in a user testing session can be the reason why your quantitative metrics look a certain way. Removing that flaw can’t be the improvement you hard-code on your site, your landing pages, or your forms, without testing.
- Patterns still rule. And you can disregard outliers. You’ll always find people who struggle with the most friction-less workflow. It’s not your job to align your workflows to the needs of every individual. If several subjects trip up completing a certain task, then note the point of resistance/confusion.
On-Site Polls
What’s better than trying to guess why your site visitors won’t convert?
Asking them!
It sounds extremely simple and potent. On-site polls give marketers and optimizers an easy and relatively inexpensive way to pop important questions to their audience.
But the success of the exercise hinges on two key aspects:
- What questions you ask and how you frame them.
- When you ask these questions.
To begin conversion rate optimization with on-site polls, you first need to have an idea of what is broken on your page or in your funnel. The answers you receive from your actual site users can then inform you of the “WHY” behind your assumption.
Remember that even with the “WHY”, you are still in the realm of speculation and should test any proposed changes before rolling them out across the site.
- Understand the difference between a poll and a survey.
A poll generally comprises of one question. The answer is focused on uncovering a single pain point and narrowing down possibilities for optimizers who are past the exploration phase and are intent on fixing a particular experience for site visitors.
A survey on the other hand invites more rumination and dialogue. It may be a good way to identify initial broad site areas or experience categories that need tweaking. These categories can then be drilled further with quantitative analytics to zero in on real issues. - What is the intention behind the question(s)? The way you frame your questions or even the kind of questions you ask will tie into what you are looking to uncover. On-site survey questions map to the different stages of the Buyer’s Journey.
- Awareness: This stage won’t get you laser-focused answers about why visitors do not purchase. Awareness is Top of the Funnel and will benefit from questions related to branding, site navigation, lack of content, or in some cases lack of authority and social proof. If your home page has an inordinately high bounce rate — asking visitors if their visit intent is met (or not) is a good query.
- Consideration: The consideration phase has an influx of visitors who are now Solution Aware and rapidly moving towards the Product Aware favorable mind-set. Targeted questions around micro-conversions or behavior on key pages like Service pages or Pricing tables are a way to gather relevant information.
*Is our pricing easy to understand for you?
*Did the Features page answer your questions about what we do?
*What is keeping you from browsing more products?
*Do you think what we do (insert your service) is a good solution for your problem (insert specifics)? - Decision: Even repeat buyers have to decide to buy again. So this phase is extremely important for all industries and business models. In the decision phase, you can expect insights into friction around the most important conversions (macro conversions) for your brand.A caveat here is — don’t get too specific with the questions. Something like “Are the form buttons small?” may just re-confirm your bias that the buttons are derailing your conversion experience. As with everything, allow the data room to breathe and let your visitors show you their pain points.
*What is keeping you from buying a particular product?
*Would you recommend this Add to Cart experience to your friends?
*What is keeping you from completing the trial sign-up?
*Is it clear that the purchase comes with free shipping? - Hesitations & Motivations: Some CRO experts believe that the desire to take action is spurred on by motivations, or dampened by hesitations. Each phase of the Buyer’s Journey can lend itself to this classification. For example, if you are looking to uncover Motivations in the Awareness phase, frame your question in the positive.
*What made you navigate to this page?
*What made you share the article on Facebook?
*What did you like the best about our virtual storefront display?
- Awareness: This stage won’t get you laser-focused answers about why visitors do not purchase. Awareness is Top of the Funnel and will benefit from questions related to branding, site navigation, lack of content, or in some cases lack of authority and social proof. If your home page has an inordinately high bounce rate — asking visitors if their visit intent is met (or not) is a good query.
- What is the format of the question? Once you have sorted the intention of the on-site survey question, it comes down to the format in which you mine for insights to ensure that bias does not creep into responses and you can extract learning from the qualitative data you gather.
- Yes/No: These are closed-ended questions. There is no room or scope for the visitor to express more than what is being asked. These responses are easy to sort through and reduce user bias. However, as already discussed, if they are too specific, they can reinforce optimizer bias.
- Open-Ended Questions: These generally require visitors to type out a response. On one hand, there is context and richness. On the other hand, the response rate is in most cases lower than to Yes/No questions since these call for more cognitive processing. The data collected can’t be mapped on a neat scale and has to be interpreted.
- Multiple Choice Questions: The middle ground — they allow visitors to choose from an existing list of responses. There is more room for context and being on a spectrum since there are more options than the stark Yes or No. Optimizers also look at the response type to determine the relevance of the input to their data-gathering efforts.
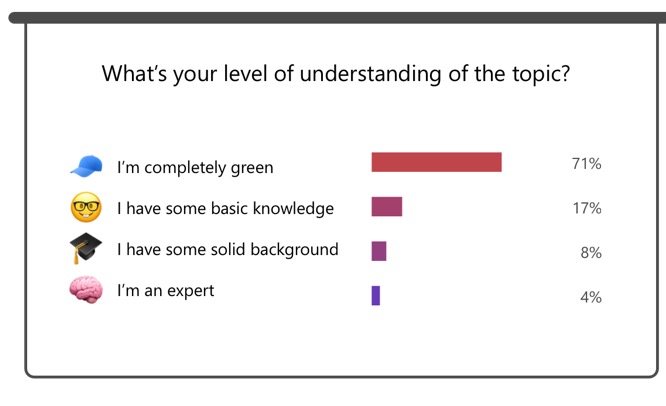
Let’s assume that you have a Multiple Choice Question similar to the one in the image shared above. It asks visitors about how familiar they are with your industry.
If most of the answers indicate that the crowd has little to no understanding of what you do and how you operate, then placing a product/service video in the hero section might be a good test to conduct for the impact on conversions. This would not make sense for a savvier crowd that probably would benefit from a strong free trial or pricing call-to-action.
- Yes/No: These are closed-ended questions. There is no room or scope for the visitor to express more than what is being asked. These responses are easy to sort through and reduce user bias. However, as already discussed, if they are too specific, they can reinforce optimizer bias.
- Where should you ask the question(s)? You can trigger the survey question to pop on the display of exit intent. Or you can place the survey modal after completion of macro and micro conversions. The Motivation or Hesitation being studied impacts the decision of the location.
Exit intent polls and surveys are more geared towards understanding why visitors are hesitant and abandon a task.
On the other hand, surveys and polls on thank-you pages can measure satisfaction and motivation.
USING ON-SITE SURVEY DATA
- Let the data answer the “WHY”, but make it go a mile more. Open-Ended questions can write your site copy for you. They can do a better job than an expensive copywriter.
Borrow the words your visitors use to define their problems and your services (solutions), from them. This will automatically optimize your site for how much your prospects care about what you have to say. - Yes/No format questions in the broader scope of research can help you pinpoint the experiences that reduce your conversion numbers. “Was the free trial sign-up easy?” An overwhelming No is a dead giveaway. But it is nothing more than a start and should be treated as such.
- Analyze patterns from Open-Ended questions. Again, this is a numbers game. More than how certain site visitors describe particular experiences, look for recurring themes. Is the navigation a constant mention? Are the forms aggravating visitors? If you mine this data for red flags and not fully-fledged solutions, you will be on your way to a solid hypothesis.
Chat & Support Tickets
Chat queries and support tickets may not directly answer your most pressing conversion rate optimization queries, but they can do two things:
- Highlight what needs to be improved (if you are starting with your optimization research).
- Point to the “WHY” behind broken experiences.
How to Optimize Your Site with Chat Data?
- Segment for Context. Sort chat questions and support queries by the page on which the chat was triggered, and the area of the service or the app that was associated with the support question.
- Clarify the Motive. Are you looking for problem areas or are you looking for the “WHY”?
If you haven’t conducted quantitative research yet and just need a starting point, simply count the chat questions or support queries under each segment head. Does the pricing table keep getting chat question hits? It probably needs to be optimized.
If you’ve already completed a preliminary analysis of quantitative data and have puzzles in the numbers to figure out, review what the chat question is asking and how the support ticket was resolved.
Let us assume that the conversion rate to free trial from your Features page is low. Visitors tend to bounce away in higher numbers as well. If support tickets indicate that free trial takers are constantly confused about how a particular feature is used, or if it is available in your app, then maybe your ideal segment will benefit from that feature being placed more prominently on the site, and the Features page in particular.
Test it!
Experimentation
Everything that we have learned about Conversion Rate Optimization has been in preparation for this stage — Experimentation.
However, before we delve into this section, it is important to understand the distinction between three terms that are used almost interchangeably by marketers and testers. They are:
- Experimentation
- A/B Testing
- Conversion Rate Optimization
Customer Experience Experimentation consultant Nick So has a unique take on the differences.
By definition, an experiment is a procedure carried out to support, refute, or validate a hypothesis. From a business standpoint, experimentation is a methodology and mindset an organization can (and should) use to answer questions and guide decisions.
Nick So, via LinkedIn.
Experimentation is the WHAT.
A/B testing is simply a method of validating a hypothesis in an experiment. Because it is a Randomized Controlled Trial, it is often the most robust and objective method of validation for online businesses.
A/B testing is the HOW.
Conversion Rate Optimization (CRO) is the WHY. CRO utilizes various forms of research to develop ideas that aim to improve website conversions. In an experimentation-driven organization, these ideas are translated into hypotheses to be supported, refuted, or validated (the WHAT) typically using A/B testing (the HOW).
If you’re a fan of Simon Sinek, you already know that the WHY is the heart of any meaningful drive.
Following that logic, Conversion Rate Optimization is a desire to discover the why behind visitor actions on a site and then leverage the power of A/B testing with the rigor of an experimentation mindset to consistently improve the outcomes.
Seeing the True Potential of Experimentation
The word “rigor” is of the utmost importance when conducting experiments.
If you’re not careful, the true essence of experimentation is lost and it devolves into lip-service to data analytics and A/B testing.
Experimentation isn’t a one-time task.
It is a long-haul commitment. It requires a deference to the insights derived from data and from pitching assumptions against the truth (revealed through testing). Once a brand commits to experimentation, it can no longer operate based on the HiPPO (Highest-Paid-Person’s- Opinion). The mindset of experimentation may start on site pages, but it certainly can’t end there. It seeps into all the nuts and bolts of a brand’s strategy, influencing even admin and Ops.
If you are starting out with experimentation & CRO, keep these experimentation pitfalls in mind:
- Front-end changes aren’t the height of experimentation. They must evolve into testing your web presence, web strategy, and your development as a whole.
- Not all tests can win, so focus on learning. In fact, according to research based on the tests conducted with Convert Experiences, only 1 in 5 tests reach statistical significance, which is indicative of a conclusive winner or loser. And an even smaller percentage of tests actually go on to win. Focusing only on finding “winners” is going to disillusion the company and jeopardize the testing program. While Conversion Rate Optimization does indicate a desire to improve outcomes across an online property, this improvement can come in the form of learning from the process of experimentation, and not necessarily just through winning variants. Remember — experience is crucial, and experience is expensive. Experimentation builds up your repository of experience.
- Large sweeping wins may not come. There is a debate in the industry around this. While some CRO agencies admit to “digging for oil” to fuel conversion uplifts that will potentially wow clients, veterans like Peep Laja warn explicitly against ignoring the smaller upticks.
Here’s the thing. If your site is pretty good, you’re not going to get massive lifts all the time. In fact, massive lifts are very rare. If your site is crap, it’s easy to run tests that get a 50% lift all the time. But even that will run out.
Peep Laja, CXL.com
Most winning tests are going to give small gains—1%, 5%, 8%. Sometimes, a 1% lift can mean millions in revenue. It all depends on the absolute numbers we’re dealing with. But the main point is this: you need to look at it from a 12-month perspective
Bottom line: Don’t trivialize your wins, no matter how tiny the improvement. Ongoing encouragement is crucial to stakeholder buy-in, and user adoption for experimentation across the company. - Process trumps willpower. If you wish to scale your experiment velocity and focus on increasingly “smart” hypotheses, a process is non-negotiable. You simply can’t reinvent the wheel for each test that goes live. This can introduce bias, is the antithesis of the convenience you need to effectively scale, and can exhaust innovation with admin concerns.
A sequence of best practice and experience-based steps is the secret to what’s known as the Culture of Experimentation.
[WEBINAR] Understand the Culture of Experimentation
[WEBINAR] Why Tests Fail & Why That’s a Good Thing
Experimentation Frameworks
While frameworks to prioritize A/B test ideas abound, actual experimentation frameworks that help you make sense of the data gleaned from your Research phase are relatively rare.
At least the ones that make sense to marketers and savvy CRO experts alike.
One framework that ties everything together in a logical, concise, and visual manner is developed by CRO agency, Conversion.
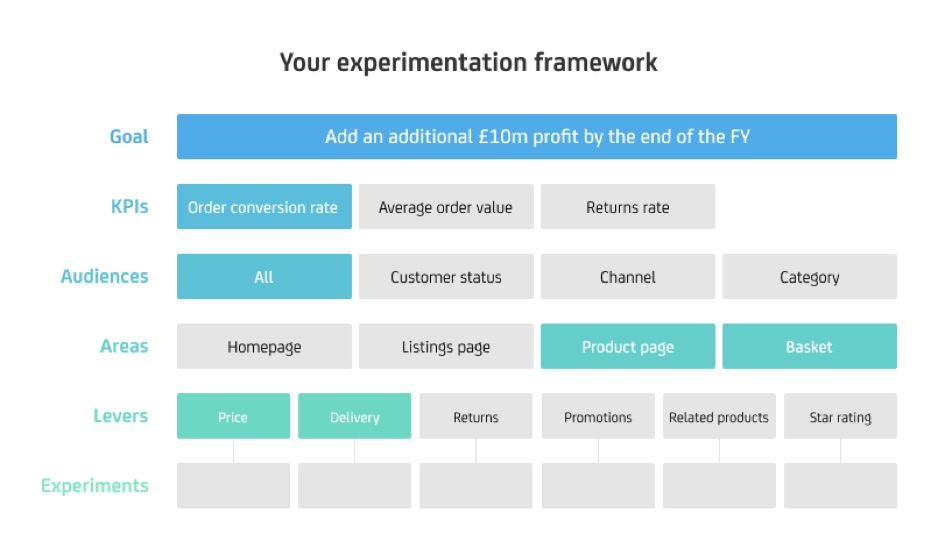
The model is pretty self-explanatory. In a snapshot, this is what it suggests:
- Set a S.M.A.R.T goal for your optimization campaign. This goal must be tied to your focus as a company or a department, because experimentation is not the job of a lone warrior. It needs buy-in from the entire organization to succeed.
- Identify KPIs that can act as Leading and Lagging Metrics to measure the success of the experiments you will be running.
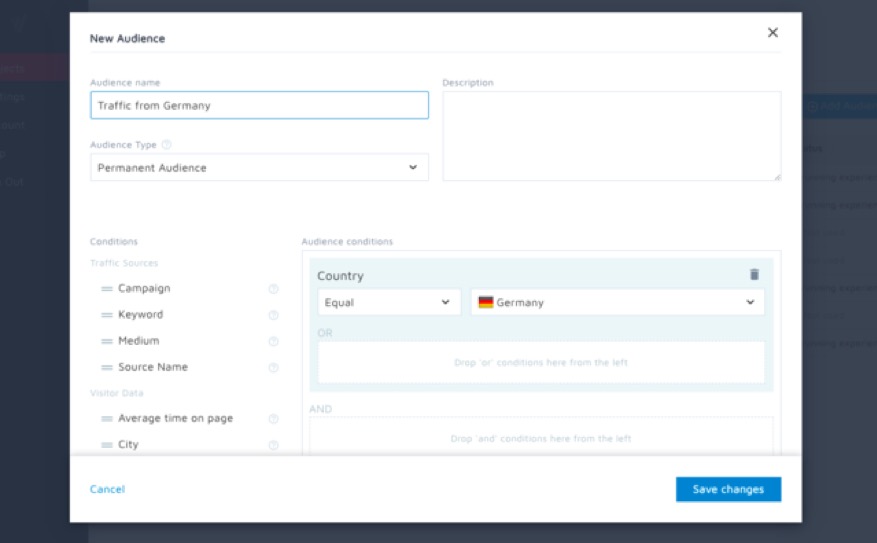
- Identify your target audience. Once you’ve conducted quantitative and qualitative research, this should be relatively simple. But do not underestimate the power of serving variants to the right audience segments. With testing — especially A/B testing — you are projecting anticipated behaviors of a small group of people for a larger pool. If you test traffic that does not contribute to the S.M.A.R.T goal you have in mind, you may get a winner, but the winning variation will fail to perform in the live setting.
Convert Experiences offers 40+ targeting filters to create granular audience segments:

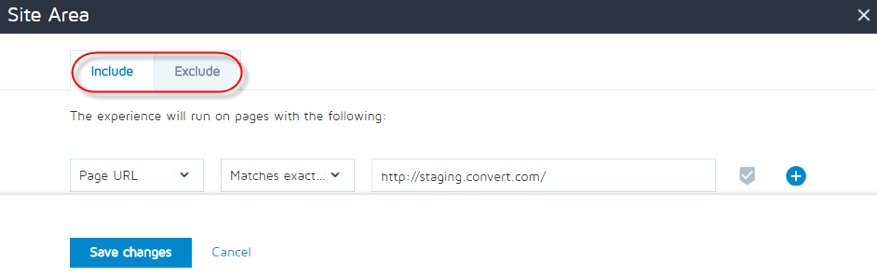
- Identify site areas to experiment on. This is where the data from analyzing traffic funnels and user journeys come in handy. Sections with poor engagement, large drop-offs, or even site areas that are cold and unused in heat maps (despite being on high impact, high traffic pages) are prime for experimentation.
A/B Testing tools like Convert Experiences offer the ability to include and exclude pages for experimentation and even trigger custom JS conditions on chosen site areas.

Plug this information into a hypothesis generator to create credible, simple hypotheses, which can then be tested for validity.
We reached out to our agency partners, Conversion Fanatics in the US and Browser to Buyer in the UK, to get a better sense of how this process differs across continents and markets.
Justin Christianson goes with a simple approach that eliminates unnecessary overwhelm. He focuses on:
- Avoiding analysis paralysis.
- Informing initial hypotheses with qualitative & quantitative data, but letting the actual experimentation reveal the plan for iterative testing.
Dave Gowans is methodical in his thinking. He recommends:
- Clearly identifying high impact test ideas and then experimenting with them.
- Leveraging Barriers & Motivations to frame hypotheses from the data collected.
Hypothesis Generation for CRO
What is a hypothesis? Is it the same as a hypothesis in a scientific research program?
Before we investigate hypothesis and hypothesis generation, we need to understand that the changes we make to our websites, landing pages, and other online assets to improve user experience and ultimately conversion numbers can be clubbed under the umbrella of Online Controlled Experiments.
This serves to do two things:
- It puts you – the optimizer – in the experimenter’s seat. In a scientific experiment, there is an outcome. But the outcome is not what everyone is obsessively focused on. It’s the objective learning from the process and the collected data that is the real “win”. While it is understandable that marketers are under a lot of pressure to tie everything to revenue and bottom-lines… donning the lab coat of an experimenter helps you be open to learning in every conceivable format.
- It roots for scientific rigor. A/B testing is just one of the ways to experiment online. Whenever you propose a change to your site based on data, qualitative or quantitative, you are experimenting to improve outcomes. It helps to see that since the exercise is no different from a more formal scientific experiment, your efforts can also benefit from a well-defined experiment framework that limits chances of bias creeping in, data getting polluted, or results being called to serve an ulterior motive.
What Is a Hypothesis in Conversion Rate Optimization?
In the world of Conversion Rate Optimization, a hypothesis is an educated and data-driven prediction that a specific change to an independent variable (like a site element or UX flow) will lead to a quantified impact on a dependent variable (represented by a metric you have already identified for measurement).
Sometimes a hypothesis is also defined as the cause-effect pair. The cause is the change to the independent variable, and the effect is the response of the dependent variable.
Here are some examples of independent variables in CRO are:
- Images
- Copy
- Headlines
- Form fields
- Button size
- Layout
- Delivery of content
- Required data fields
Examples of dependent variables include:
- Click-through rate
- Open rate
- Conversion rate
- Scroll depth
Let’s see this in action.
You have a form with 7 form fields. 5 out of the 7 are required. The form submission conversion rate is 3%.
Your first indicator of the fact that something is off comes from a State of the Industry report you read where the average conversion rate for your product and industry on a micro commitment like a form submission is 5%.
This is a red flag that your form could possibly perform better.
You invest in heat map data and user research. The qualitative data indicates high form abandonment when users are presented with the field to indicate their annual income.
Candidates in the user research drive express skepticism around why sensitive personal data is needed to process the request for a free 1:1 demo call.
Based on the information, you can see that potentially reducing the number of form fields and pruning the request for personal data can lead to more conversions.
In this example, the form fields are the independent variable. They can’t change unless you change them. The form submission is the dependent variable. If you add the request for credit card details, chances are the submissions will plummet further. If you reduce the form fields to just one — Email Address — the number of people who go through the process of submitting the form will likely increase.
The metric you choose to quantify the behavior change or the response of the dependent variable is also important. It should capture the change in the desired behavior — form submission — directly, and without room for misinterpretation.
In this case, the most logical metric is the form submission rate. You can choose a couple of secondary or guardrail metrics as well.
How to Come Up with a Hypothesis?
- Set goals for your online conversion assets. These are landing pages, blogs, forms — all the elements that are a part of your funnel leading to the conversion of leads.
- Measure performance against the goals. You can reference industry data if you would like to evaluate whether your goals are realistic given your market. But your drive for improvement should guide experimentation. Not the average of your competitors.
- Once the quantitative data shows that something is off, zero in on what may be “broken” with the help of qualitative data. Remember, qualitative data answers the important question, “why”.
- If a roadblock has more than one possible solution, prioritize these solutions. We will cover how to prioritize in the next section.
- The solution that promises the biggest uptick in conversions while consuming the least resource is generally the winner. This is vastly simplified. But true. For the winning solution, isolate the cause (the independent variable) and the effect (the response of the dependent variable).
- Frame the hypothesis using a hypothesis generator. Convert has created one that helps marketers and optimizers take into account the ethical and moral impact of launching the test on website visitors.
Even though an A/B test is run online, it can modulate user behavior or influence mood. Offline research would never take place without participant consent. The least conversion rate optimizers can do is ponder the ethics of pushing experiments live.
We have also written an in-depth guide on framing complex hypotheses for online properties where the low-hanging fruits have already been picked.
What Does an A/B Test Hypothesis Look Like?
The key parts of a hypothesis are as follows:
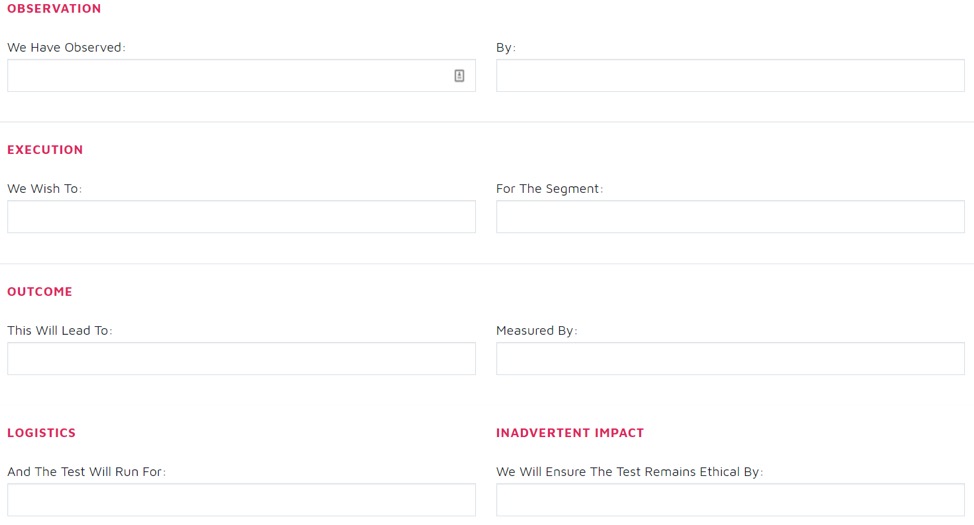
Here is an example of a real hypothesis that has driven change at Convert.
The numbers have been altered to protect our data.
We Have Observed that the free trial form converts at 40% By reviewing the free trial Google Analytics funnel. We Wish To remove the form field requesting a contact number For the Segment mobile Visitors. This Will Lead To a smoother submission experience on a hand-held device leading to a 10 percentage point increase in form submission Measured By the free trial Google Analytics funnel. And The Test Will Run For 3 weeks. We Will Ensure The Test Remains Ethical By not changing any claims made for the core offer of the free trial and only eliminating the phone number field since it does not alter the trial experience.
While the process of getting to a hypothesis in most cases is fairly standardized, there is flexibility around what a hypothesis can read like.
Matt Beischel of CorvusCRO recommends a streamlined Comprehension – Response – Outcome formatwhere Comprehension stands for understanding the problem, Response stands for making targeted changes to solve the problem and the Outcome is self-explanatory.
Prioritizing Ideas for Experimentation
After you’re done with a robust site audit, you will likely come up with dozens of ideas to improve outcomes for your business.
Good quality and reliable quantitative data help narrow down the options. If you have targets set in place for site performance, it is easy to go after metrics that are not pulling their weight to further investigate the problem areas.
But in general, prioritization is as important as analysis and experimentation. In fact, veteran optimizer Jonny Longden of Journey Further says:
“Intelligent prioritization is the key to increasing the pace at which conversion optimization delivers value…
But it isn’t enough to just prioritize according to what you think will work; this is just opinion layered on opinion.”
Prioritizing Research in Conversion Rate Optimization
So how do you prevent the layering of opinions in the name of A/B testing & optimization?
Prioritization helps in two key stages.
The first is prioritizing research.
Don’t audit your entire site. And even if you do, don’t consider all site areas and workflows equal. If multiple user interactions feed into a critical metric that’s underperforming, choose to optimize the interactions that have a higher value.
- What elements does the interaction involve? A main CTA click is worth more than a hyperlink click.
- Which stage of the buyer’s journey is being called into play? Given the context of the metric, Awareness stage interactions are generally less important than Consideration/Decision phase actions.
- Which site area are you going to look into first? For an E-commerce store, the cart and the checkout pages are no-brainers. For a SaaS company, it is probably the free trial form.
While this won’t eliminate bias for good, it is better than the overwhelm of excessive data, and the inevitable meddling by HiPPOs to determine which data set drives optimization efforts.
Prioritizing Ideas in Conversion Rate Optimization
When the research has concluded, prioritizing ideas with a framework proves useful. There are three popular frameworks leveraged by optimizers:
- PIE
- ICE
- PXL
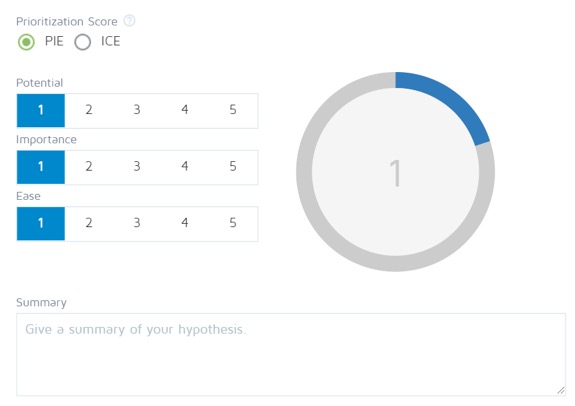
PIE
Here, P stands for the Potential of the idea that is about to be implemented. Potential is a vague term and stands for the anticipated improvement from the experiment.
I is for the Importance of traffic. What kind of traffic is being driven to the page or the location where the changes will be deployed? Echoing the sentiment of research prioritization, warm traffic that’s ready to convert deserves more optimization attention than cold traffic bouncing off an Awareness stage page.
E is Ease. How easy will it be to implement the change and push the experiment live? Will you need hundreds of thousands of visitors to reach statistical significance or is the sample size requirement similar to the traffic your site already receives?
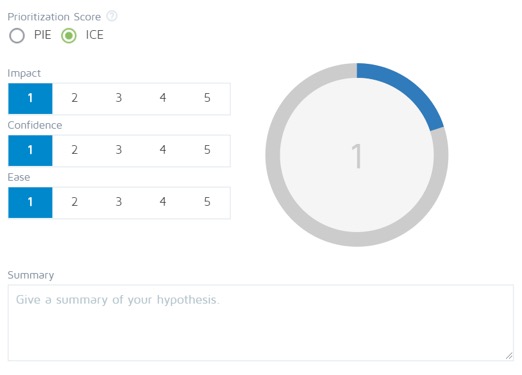
ICE
In ICE,
I stands for Impact. What might be the impact of the experiment on the site?
C stands for Confidence. How confident is the optimizer that the test will reach significance and will indicate a better performing variant against the control?
E stands for Ease. Again, this is very similar to the PIE framework.
These frameworks are handy. But they have their drawbacks:
- There is the question of the layering of opinions. PIE asks the optimizer to guess the potential of the test. ICE goes a step further and even asks for confidence in the test.
- Often the scale for scoring is too broad. This allows more subjectivity to creep in.
- Finally, the frameworks are rigid with little room for customization.
To counter these issues, CXL has created the PXL framework which introduces a degree of objectivity to some of the vague terms — impact, potential, confidence.
What it does is it breaks down the gut feeling about a test into quantifiable factors that are on paper and thus go a long way in preventing bias or blatant layering of opinions.
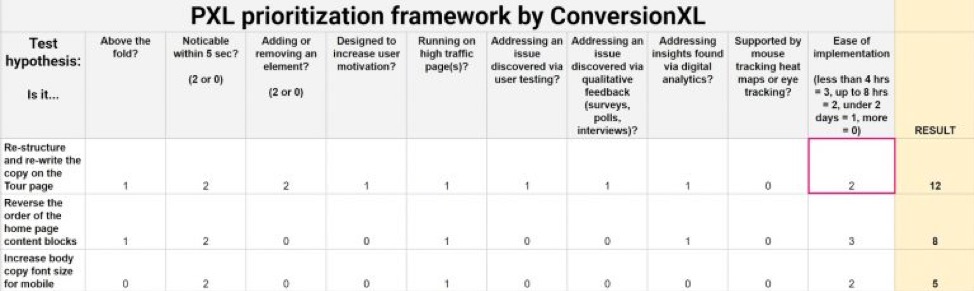
Here, optimizers take into account whether a test is:
- Above the fold
(In the hero area)
- Noticeable within 5 seconds or less
(A more noticeable element is a worthier optimization candidate)
- Adding or removing an element
- Designed to increase or decrease motivation
- Running on high traffic pages
- Addressing a problem that is identified through qualitative feedback, digital analytics, or tracking
(A problem that’s spotted in all three research channels is again a stronger candidate.)
- Easy to implement
(And there is a key to define what should count as “easy” and what shouldn’t.)
To find the idea that goes through to testing.
Jakub Linowski of GoodUI interjects this narrative with a valid question.
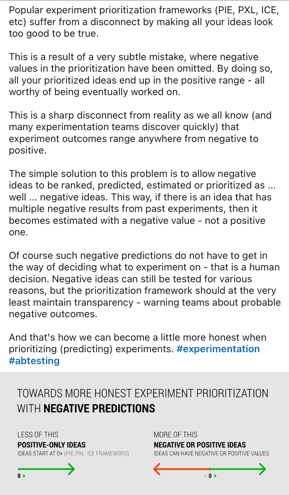
Why do prioritization frameworks assume that all ideas are worth testing and thus have factors with only positive scores?
What about potentially detrimental ideas that can cause an actual dip in the existing performance of a page?
Think about it!
A scoring system that quantifies a “bad” idea can help optimizers come up with more contentious hypotheses, because the safety net of considerations will actively eliminate options that don’t make sense.
The Role of A/B Testing in CRO
Often, the terms CRO & A/B testing are used interchangeably.
While A/B testing has garnered a lot of attention as the statistically sound way of identifying site changes that can influence user behavior driving more conversions, it is not the only spoke in the wheel of Conversion Rate Optimization.
Take a look at this section of the CXL 2020 State of Conversion Optimization Report. It ranks the effectiveness of various CRO components, as voted by optimizers.
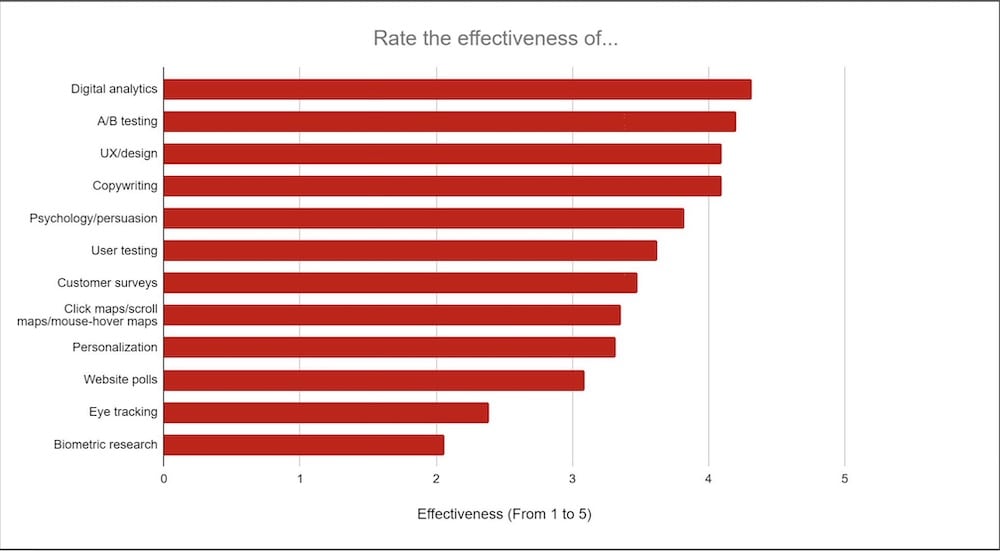
It clearly shows that A/B testing is ONE of the ways in which conversions and outcomes can be improved.
Digital Analytics, Conversion Copywriting, Customer Surveys, User Testing… are the other candidates.
If you’ve been reading this guide for a while now, the question on your mind might be: Did we not use the methods of digital analysis, heat map tracking, user testing to uncover potential A/B testing opportunities?
Yes, we did.
And no, this does not mean A/B testing and the other components of Conversion Rate Optimization are mutually exclusive.
- A/B testing is the most rigorous and statistically sound way of improving conversions across your sites, landing pages, and other online properties.
- User research, heat maps, surveys help in gathering qualitative data. But as already discussed, they are open to bias.
- Even quantitative data from sources like Google Analytics must be interpreted. This always leaves room for unconscious data manipulation to suit preconceived notions.
- In A/B testing, however, if the confidence of the test is high enough (a recommended least of 95%) and the power of the test is 80% or more, you can be fairly certain that the conversion lifts you are observing in the test are not a result of randomness, and that the independent variable you have changed through your hypothesis is quite likely an improvement that the rest of your users will also respond positively to. When testing mission critical pages, it is recommended to plan the test with both parameters (confidence and power) set at 99%.
A/B testing puts science on your side. It is one of the most viable ways to establish a causal link between intended actions and results and translate data into actual revenue for your business.
Why Can We Work with a Sample & Get Away With It?
Simply put, when you conduct an A/B test, you hypothesize that a particular change to an on-site element will lead to more of the user behavior that benefits your brand (in most cases, conversions).
And you put this educated assumption to the test by exposing a representative sample of your visitors to the control (the original version without any change) and another representative sample to the variant (the version with the hypothesis deployed).
The Role of A/B Testing Tools:
An A/B testing tool gives you a secure platform to put the variant live without hard coding these changes into your site.
It also buckets site traffic into seeing the control or one of the variants while respecting the proportion of the traffic that should participate in a test.
Plus, an A/B testing platform interprets the statistical aspect of the experiment for you, indicating a winner based on the confidence and power thresholds you set.
While it is highly recommended that you understand how your testing tool calls a winner, most of the heavy lifting can be delegated to a robust A/B testing tool.
If you are looking for a flicker-free, statistically transparent A/B testing platform, you can give Convert Experiences a free, 15-day spin.
When you specify a confidence level of 95% for an A/B test, you want to accept only a 5% chance (1 in 20) that any conversion rate improvement that may result from the experiment can be traced to randomness, and that there is no substantial difference between the control and the variant (null hypothesis) in terms of impacting desired conversion behaviors.
You can increase this confidence requirement to a high 99%. And you would quite possibly ensure that no false positive (the scenario where you don’t reject the null hypothesis when it’s true) creeps into your test.
The downside of having a very high statistical significance is the fact that your test may take a longer time to be significant, as the test would need to collect more samples.
Significance thresholds help experimenters confidently consider data for analysis.
On a site that does not receive millions of visitors a month, a 99% statistically significant test could take weeks to conclude. And in the meantime, if the changes you’ve made to the variant are in fact negatively impacting conversion rates, then your revenue could suffer, as you look for improvement opportunities. That is why, when your site has a lot of traffic, it’s always good to allow only a certain percentage of your total traffic to enter an experiment.
Determine the sample size needed for your A/B tests. We’ve made a calculator for you.
Through A/B testing you can work with a sample of your site traffic to deploy changes that work for your entire traffic flow. As long as external factors stay the same and something drastic like a recession that can alter the buying patterns of people does not happen!
A/A Tests
When you start running A/B tests, you will frequently come across the term “A/A testing”. It is creating two versions of the same page with your A/B testing solution and pitching them against one another.
Here, the null hypothesis is intentionally true. There is no significant difference between the pages and thus traffic in the samples should similarly react to them.
In most cases, this is true.
A/A testing should not spit out vast differences in conversion rates (or your chosen goal metric). The goal is to make sure the experiment is well set up and the platform one uses is working properly, that there are no issues at the randomization and bucketing level for instance. And A/A testing requires a larger sample size compared to A/B testing to eliminate variations caused by randomness.
In any case, if you wish to go the A/A testing route:
- You’ll know whether your A/B testing tool is set up accurately, or not,
- You will be able to get a good sense of the baseline conversions on the page (control).
P-Value
Let us assume you’re running an A/B test on two landing pages selling the same product. The first one (we’ll call it A, or the control) does not have 3D product images. The second one (we’ll call it B, or the variation) has them.
The conversion rate in terms to “Add to Cart” is 7% for A and 9% for B. So should you just add 3D images to your product pages across the site?
No! Because all the visitors to your website have not seen page B and you can’t make assumptions about their preferences simply from observing the behavior of a much smaller sample size. Right? (PS: Don’t make assumptions in marketing or optimization… being data-driven is the way to go).
How to solve this little problem?
P-value comes to the rescue.
P-value will give you the probability that you have seen a 2 percentage point increase in the “Add to Cart” KPI for your variation (Page B) simply because of luck or other random factors.
The smaller the p-value, the greater the chance that adding the 3D images meaningfully contributed to the uplift in conversions and would likely apply to all the visitors coming to your website. Ideally you want your p-value to be inferior to 0.05, that corresponds to a 5% significance level, in other words a 95% confidence one.
You rarely need to calculate the p-value for your tests. This is done in the back-end by your A/B testing engine.
Statistical Significance
P-values do not operate alone.
They need to be held in check by something called a significance level or threshold. Think of it as the promise data scientists make to themselves to not fall in love with their hypotheses.
Say you are really impressed by those 3D images. To the point that even if the p-value tells you that there is a big chance that the increase in conversions means nothing, you still go ahead and roll them out.
Not a sound decision!
This is why A/B test results must be statistically significant. To rule out biases and make sure your budget is spent on the best bet!
The rule of thumb is to choose a probability level up to which your test’s p-value can go before you have to admit that the variation is no good.
This level is generally taken to be 5%. When you have a 5% risk tolerance, it means that if you randomly pick visitors from the people coming to your site, only in 5% of the cases (1 in 20) would you see a 2 percentage point increase in “Add to Carts” because of luck or noise.
95% of the time we can conclude with reasonable confidence that the 3D images have enhanced the shopping experience in some way, leading to the improvement.
The Power of Your Test
The power of an A/B test is an intuitive concept. It is easier to grasp than the trio of p-value, confidence, and statistical significance.
It is the ability of the test to detect an improvement in the goal metric when the control and the variant are actually different in terms of how they impact user behavior.
A/B testing tools recommend a statistical power of 80% for regular experiments and a power setting in the high 90s if the experiment involves rolling out a change that’ll consume a lot of resources to go live.
The more power you give your test, the more “sensitive” it is to detecting conversion lifts. This is why tests with higher power have smaller Minimum Detectable Effects (MDE) and require larger sample sizes to conclude.
Testing on Low Volume Sites
Despite best intentions, sometimes being 95% certain of your A/B test results is just not feasible in terms of the resources involved.
So should sites with a low volume of visitors just forego A/B testing?
The answer is no.
Low traffic volume sites should focus on CRO with more vigor and bolder changes (that can cause higher effects, that will reach significance faster). Likely, the resources they’ll need to quickly fix broken flows and get more revenue through the door are going to be less than the resources needed to increase traffic, either through costly PPC or through time-consuming SEO.
Smaller sites can always leverage other components of Conversion Rate Optimization (including heuristic analysis) for upticks and wins.
If they can reduce their risk aversion to go with lower confidence levels on changes that don’t cost a fortune to build out, they can run A/B tests to not only call winners but also gather data to inform future optimization efforts.
Learning
A “true” winning A/B test is elusive:
- Only 1 in 5 A/B tests results in a conclusive winner. We at Convert analyzed 28,000 experiments in 2019 and 80% of these tests did not result in an accepted definition of a win.
- Even when tests win, the translation of the test into real-world uplifts is not a given. A/B testing statistics are complex. If you are solely focused on finding a winner, you can find one! Will this winner massively improve your revenue? That’s up for debate. We are not asking you to question the validity of A/B testing. We are asking you to have a healthy skepticism of a winner, especially if a rigorous testing process to ensure no peeking, the right confidence and power settings, and the right expectations was not put in place.
This is where concepts like CRO Maturity and the simpler Experimentation come in.
The premise is A/B tests are ways to learn more about the behavior of audience segments. The learning can be used to inform decisions, strategies, and changes, not just on a site, but across an organization and a business.
A/B testing is the foundation of an experiment-driven mindset. And as already stated, it is the most viable way marketers have to turn audience interactions with their branded touchpoints into more engagement, better site experiences, and ultimately more revenue.
The focus should be on learning first, immediate gratification second.
In the words of Matt Beischel from CorvusCRO, experimentation provides certainty in uncertain times.
Considering A/B testing in isolation will undermine its importance and turn a process that’s supposed to eliminate uncertainty into one that’s riddled with uncertainty.
Will the hypothesis prove to be true? Can the results be replicated outside the test environment? The list of what-ifs is unending.
A learning-first expectation from A/B testing — and not just a bid to improve conversion rates right away — can flip this needless anxiety.
Look at Netflix, Amazon, and LinkedIn…
Questions You Can Answer with A/B Test Data
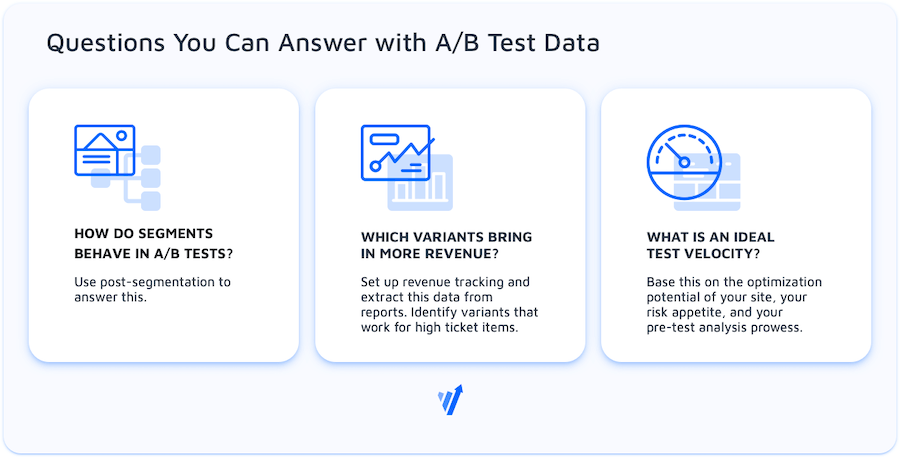
What Have You Learned About Segment Behavior from the Test?
The result of an A/B test is like an onion.
It can make you cry… in disappointment (if you’re in love with your hypothesis), or in joy (if you are eternally seeking truth and knowledge).
But most importantly, a winning variant is probably sitting on some shocking revelations. Simply put, a variant that wins may have lost in terms of performance for some audience segments.
This is where post segmentation comes into play.
It is an accepted best practice to look closer at the way a winner has behaved across all viable segments.
Most A/B testing tools like Convert Experiences allow testers to slice and dice the report based on factors like:
- New/returning users
- Browsers used
- Devices used
- Campaigns clicked
- Resident countries
… so that no insight or learning is lost.
If you do find that a winning variant loses out to (say) the control for a segment like PPC traffic, you can either set the winner live for only the segments that truly found it useful, or you can start optimizing the control for PPC traffic in a new A/B test.
If the end goal is to learn and to improve user experience, not digging deeper is defeating the purpose of the exercise.
Which Variant Brought in the Most Revenue?
This may seem counterintuitive, but often a winner with a significantly higher conversion rate can actually make less money than the control or other losing variants.
This is a common occurrence in the eCommerce industry.
Drilling into the A/B test report to identify variant success by revenue is often a game-changer. If a particular experience ticks the checkmark of higher conversion rate (supposing that’s your primary goal) but loses out on the revenue requirement, then two conclusions can be drawn:
- The winner needs to be revamped to perform better for revenue (Revenue optimization as opposed to conversion rates)
- The variant with more revenue is appealing to high ticket buyers. This is a hidden optimization opportunity with a potentially large impact on the bottom-line.
Convert Experiences reports offer the ability to look up variant winners based on revenue, plus the provision of easy Revenue Tracking as well.
Explore the Learning You Can Gather from Your A/B Tests.
Give Convert Experiences a try.
What Should Be Your A/B Test Velocity?
How many tests should you run a month? In a year?
According to the State of Optimization report for 2019, CXL found that most optimizers run no more than 1 test a week. 2 in 5 run 2 tests per month.
While more testing is related to more learning, only you can determine the actual testing velocity for your program. This depends on several factors:
- How optimized your site already is. Have the low hanging fruits been picked? Has the local maximum been reached? Are you aiming for what’s broken and in plain sight, or are you seeking more elusive opportunities? If you know what’s off in your funnels and they can have an immediate impact on your user experience and the metrics that matter, you will rapidly fill in your test pipeline. It may take a while for you to get into the groove of deploying A/B tests, but once that initial learning curve is out of the way, you could consider testing frequently.
- The traffic to your site. We have already clarified that traffic to your website is not a deterrent to testing. You just need to find ideas that can be validated with a higher risk tolerance. But if you do have sufficient volume to conclude tests with the textbook confidence & power settings on an accelerated timeline, then you may find yourself testing more often.
- Pre-Test Analysis Proficiency. At the heart of a good A/B test is a hypothesis that’s based on quality data. But collecting quality data is no mean feat. Check out this process by Rich Page. There isn’t a dearth of ways to generate insights, but they all require a commitment of resources and the curiosity to learn (rather than jump to the conversion rate improvement). If you have nailed this discipline, then testing more will come naturally.
In any case, you have to start!
As you begin A/B testing, the frequency with which you win and the learning from the “losers” will help you evaluate the quality of your ideas, the integrity of your data collection processes, and the discipline with which you stick to segmenting results.
From here on, you can rinse and repeat to find a balance between test velocity and respecting the ground rules of rigorous experimentation.
Presenting an A/B Test Report
It’s not enough to learn from an A/B test and keep it to the CRO team.
A/B testing needs buy-in — from everyone.
The best way to ensure that experimentation receives the funding it needs to move a company forward is to get all team members hooked to data. Data is addictive. It is so much easier to go off of a foundation that’s objective than to come up with ideas and arguments from scratch.
A test that’s properly conducted can blow a HiPPO to smithereens. That’s about the only kind of violence that’s needed in this brave new world we are navigating post the pandemic.
If you are running A/B tests, you need to be an adept story-teller.
Someone who can present the report in a way that goes beyond the dry run-down of statistics and focuses on the pain points of the customer, in this case, the rest of the organization grappling with opinion-laced hierarchies.
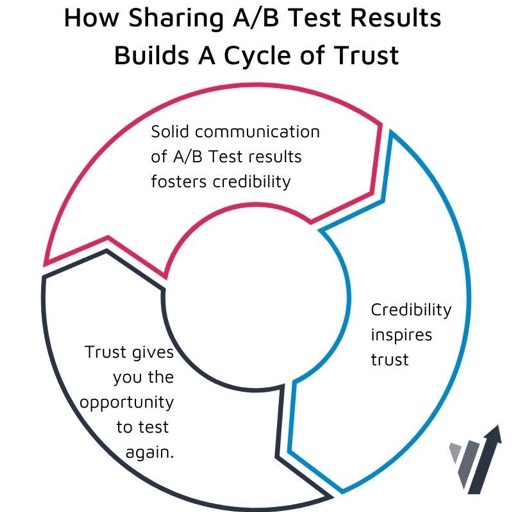
We have created a comprehensive guide on how you can present test results like a pro.
But in a snapshot, here is what you have to keep in mind:
- Testing serves the mission of the company, not the whims of the C-suite. People may not like why you conducted a certain test or the reason behind the prioritization. If you are clear on your unbiased WHY, share it with confidence.
- Start with the problem. Why was the A/B test necessary? Why did you not leave it at a survey and the subjective opinion of your users? Share the risk associated with not A/B testing an idea.
- Go visual. This is why it’s key to use an A/B testing tool that has clear reports and can offer stakeholders a bird’s eye view of the trajectory of the test. Pictures are worth a thousand words. So let your test results do the talking.
- The result isn’t a winning variant. It’s a solution. Highlight the variant that you will be deploying and focus on:
- What it will mean to the traffic coming to your site (less frustration, more trust in the brand),
- How it will impact the revenue (share projections of what the conversion rate uplift will translate into),
- What would have been the cost of inaction.
- What it will mean to the traffic coming to your site (less frustration, more trust in the brand),
You are a marketer.
You can make your stakeholders view Conversion Rate Optimization & A/B Testing as the key to business success.
Conversion Rate Optimization (CRO) & Privacy
Data privacy is a major concern for CRO and marketing.
When the EU passed the GDPR in 2018, data privacy became a multinational legal concern.
In 2020, the California Consumer Privacy Act (CCPA) looked to accomplish many of the same protections as GDPR. In Brazil, the LGPD (Lei Geral de Proteção de Dados) is to take effect in January 2021.
Unfortunately, there is no industry-wide guidance on the data privacy compliance for CRO and no case law to guide CRO specialists on the official interpretation of the laws.
The CCPA and GDPR have marketers shaking in their boots. But are they really the big boogeymen that we’re making them to be? Of course not! These regulations are intended to safeguard consumer data. Since we’re all consumers, this benefits everyone.
The best thing you can do is to understand your customers’ data. How is your department or agency collecting this information? Is it stored securely and in alignment with privacy laws?
Keep a finger on the pulse of your data practices at all times by following the steps below.
Step 1: Designate a Data Privacy Specialist
It’s easy to overlook the finer details of your marketing efforts. And when it comes to privacy compliance, it can be even easier to miss crucial components that need to be kept up to standard.
By having a designated data privacy person, you’ll be less likely to overlook critical errors. You can even outline a process for them to follow, which could involve combing over your lead gen channels, website, chatbots, and ads for compliance with GDPR, CCPA, and other.
Step 2: Train Your Team on Privacy Procedures
You likely have many team members in your company — from salespeople to marketing strategists to website managers. If everyone is well-versed in data privacy, you can prevent user privacy violations at every stage and in every department.
Step 3: Update Your Privacy Policy
Your website should have a regularly updated Privacy Policy which outlines how your website collects data and what it is used for. This will look different for every company, but it’s best to be more transparent than not.
Publicly specify how your Privacy Policy is aligned with the GDPR, CCPA, LGPD, and other consumer privacy laws. Having a clear Privacy Policy ensures that users know that their information is being collected and can opt-out if they want to.
Step 4: Build a Flow for Processing Requests for Consumers’ Personal Data
If you are a B2B company, there may be times when businesses ask for access to consumer data. For these times, you need to have a procedure in place that outlines what information you can provide and to whom.
You can do this by documenting internal workflows, noting how data is used and stored. You can create templates for your customer service or sales reps to follow. Finally, you can log customer service requests and audit your files regularly to make sure the information is secure.
Step 5: Allow Users to Opt-Out of Selling Their Personal Information
When you generate leads for your business (say, through email marketing or chatbots) do you give users a way to opt out? If not, you may be coercing them to hand over their information.
No matter what lead gen channel you use, you must give users a way to opt-out, unsubscribe, clear their data, or get removed from your list. It may seem like a lead loss, but it could save you $$$ in penalties.
Step 6: Update Client Contracts to Comply with Data Privacy
Much like your Privacy Policy, your client contracts can also be updated to reflect how your company collects and uses consumer data. Here, it may be best to consult with a contract lawyer on the issue. Again, the point is to let leads and clients know how their information is being used.
Step 7: Get Consent from Minors Before Selling Their Information
Minors between the ages of 13-16 must opt-in when consenting to their information being collected and sold. For minors under the age of 13, you must obtain consent from their parents.
You must be transparent here. Make it uber clear how minors can opt in or out of having their information collected.
By doing so, you could avoid some costly penalties.
The Bottom Line
Can CRO still be done under these restrictions? Yes, absolutely. Many of the data privacy requirements align with best practices in CRO and marketing in general:
- Under the GDPR and CCPA, the less personal information you gather, the better. Conveniently, the less personal information you request in your lead form, the more you minimize friction between the user and completing the form.
- One of the principles of CRO is “fulfill the promise,” meaning that successful landing pages provide the information that a user is seeking when they click on a link. The GDPR requires marketers to make — and fulfill — additional promises to users, enhancing the sense of trustworthiness.
- It might seem tedious to request consent from a user to collect their data, but the users who do consent have very deliberately affirmed their desire to interact with your company — in a sense, to work together already.
Thus, the GDPR, CCPA, LGPD, and any new privacy law aren’t going to destroy CRO. They’re simply giving a long-overdue facelift to the Wild West of internet data practices. As a leader, it’s your responsibility to market your brand while keeping your company compliant. Stay abreast of data regulations for smooth sailing.
Understand what the GDPR & E-Privacy mean for your favorite quantitative analysis tool — Google Analytics:
Impact of GDPR on Google Analytics
Impact of E-Privacy on Google Analytics
Common CRO Mistakes That Need to Stop in 2021
When you think of common CRO mistakes, most marketers probably seek a long list of things that negatively impact conversion rates across websites.
Too many form fields…
Slow loading sites…
Confusing menus and navigation…
If you are in search of more conversion follies, the folks over at BrainLabs have an excellent compilation.
Looking for practical experience conversion mistakes from an industry veteran? Dr. Karl Blanks has dropped a lot of wisdom about issues like pulling wrong levers in a bid to improve conversion rates, not understanding the intent of the traffic coming to the site, and more. You can explore them here.
What we would like to focus on here are the flawed mindsets and the myths surrounding Conversion Rate Optimization.
It’s more than the relentless bid to increase form submits and improve transactions. It’s a marathon, not a sprint, and is the low barrier entry into the realm of true data-guided decision making. So here goes:
Conversion Rate Optimization is only about conversion rate optimization.
In reality, it is a lot more.
Thankfully, veterans like Jonny Longden from Journey Further are shedding light on the difference between hasty optimization drives with the sole focus of finding winners, and true invested experimentation that collects learning from tests, and looks to find real opportunities with a significant impact on user experience, on revenue, and on the way, a business operates.
This distinction is even more important when companies bring onboard consultants and agency partners to scale testing programs. Setting the right expectations company wide from such an endeavor influences the perceived ROI.
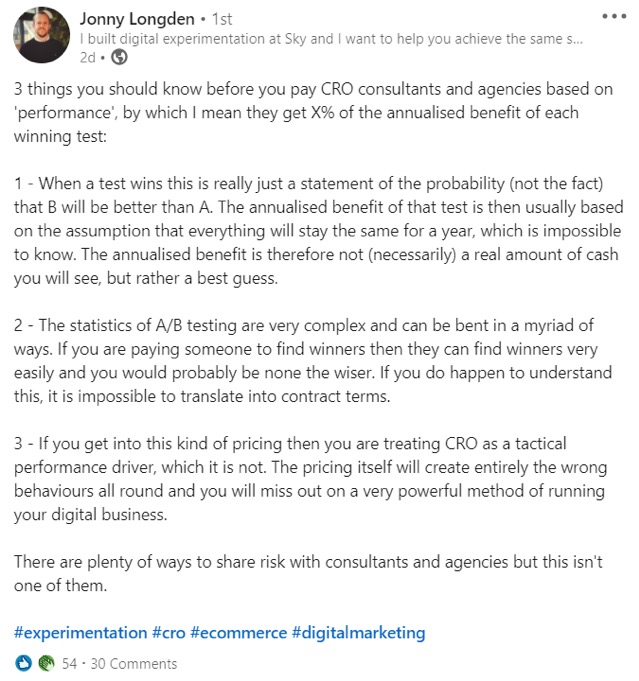
An upside of looking at Conversion Rate Optimization with a wider lens is innovation. Sometimes you stumble upon data and insights that don’t contribute to optimizing a form or a landing page… but result in unconventional successes.
A/B Testing is the same as Conversion Rate Optimization.
This myth needs to break.
A/B testing is a statistically sound way to validate the likelihood that any (positive) change in the conversion rate or overall performance of an asset — like a landing page or a form — stems from substantial improvements to the UX or to how prospects interact with them, and not dumb luck (or noise).
A/B testing should be accompanied by rigorous qualitative and quantitative data collection to craft a strong hypothesis that has been prioritized for potential.
A/B testing is just one spoke in the wheel of CRO. And it has to be supported by analytics, heat maps, user research surveys, click data, and more, to be effective.
Conversion Rate Optimization is an after-thought.
CRO is a strange and unfamiliar discipline. It’s just better to pump money into growing traffic, right?
This assumption is never going to benefit a business again. Conversion Rate Optimization is a practice that comes naturally to human beings. We like to learn and we like to improve. This duo is the evolutionary advantage that has given us an edge over every other living creature. Fundamentally speaking, CRO too is a constant improvement.
According to the CXL State of Optimization report from 2019, most optimizers struggle to secure funds for their experimentation programs. And even when they do they are bogged down by:
- The expectation that conversion rate optimization and A/B testing will mint money with every experiment.
- Lack of buy-in from team members and skepticism from the C-suite.
- The tendency to cut resources from the experimentation team in the form of both people and tools at the slightest sign of trouble on the horizon. The recent pandemic has been a classic example of this.
- The notion that growing quality traffic to the site is easy, and by comparison Conversion Rate Optimization is time-consuming, difficult to execute, and “not worth it”.
To pull an organization out of the rut of thinking that CRO is at best an after-thought, marketers and testers must highlight the benefits of CRO beyond conversion lifts.
CRO is the basis of providing better experiences to prospects and is the most objective and data-fuelled way to be all about the customer.
Conversion Rate Optimization is all about tools.
You do need tools to gather insights, prioritize experiments, and A/B test ideas.
But a tool stack can only complement human genius. It can’t replace decades of professional acuity, knowledge, and the ability to modulate testing processes based on the risks involved in breaking rules — say, calling a winner early — given the context of the experiment.
Most businesses want the bells and whistles when it comes to choosing an A/B testing platform. But in reality, their teams end up using only a handful of key features that are frankly found in almost all the tools in the optimization space.
Conversion Rate Optimization calls for a plethora of skills — survey and heuristic knowledge, UX and design chops, copywriting abilities, the understanding to interpret data without bias, introductory statistics know-how, and dogged persuasion.
It is difficult and expensive to hire the right candidates. And upskill them to a point where they can make significant contributions to the optimization program.
It is in the best interest of the industry to reserve resources for a robust team over an exorbitantly priced tool
Conversion Rate Optimization is at odds with Search Engine Optimization.
There are two things to keep in mind here:
- Shoddily conducted split tests can look suspiciously like redirection or cloaking to search engines. Flickering also impacts user perception leading to higher bounce rates and thus poorer SERP rankings. But these are mostly Quality Assurance (QA) issues that should be taken care of with a series of best practices, either before deploying a test or when archiving it.
- Search Engine Optimization focuses on creating better content to match the information intent of browsers who want to get a particular job done with the help of search engines.
SEO is no different from CRO since it aims to improve the experience of prospects and leads interacting with company-branded touchpoints.
The whole premise of SEO (and of search engines) is to present the right content, at the right time, and in the right context and enhance a brand’s reputation.
We can easily argue that CRO & SEO are meant to go hand-in-hand.
SEO is a part and parcel of Conversion Rate Optimization, especially the on-page and technical aspects geared to load pages faster, eliminate broken links and jarring experiences, and seamlessly serve user requests while minimizing the consumption of site resources.
There is no doubt though that things are looking up for the relatively young industry of Conversion Rate Optimization.
Brands like Amazon and Netflix have made strong cases in favor of CRO and A/B testing, and thanks to the positive (and realistic) buzz around their success, businesses in the know are steadily prioritizing optimization, year over year.
We still have a long way to go and the first step is education.
Conversion Rate Optimization can fix broken funnels and open them up to scaling. Something all businesses understand, desire, and want.
A Comprehensive List of Conversion Rate Optimization Tools
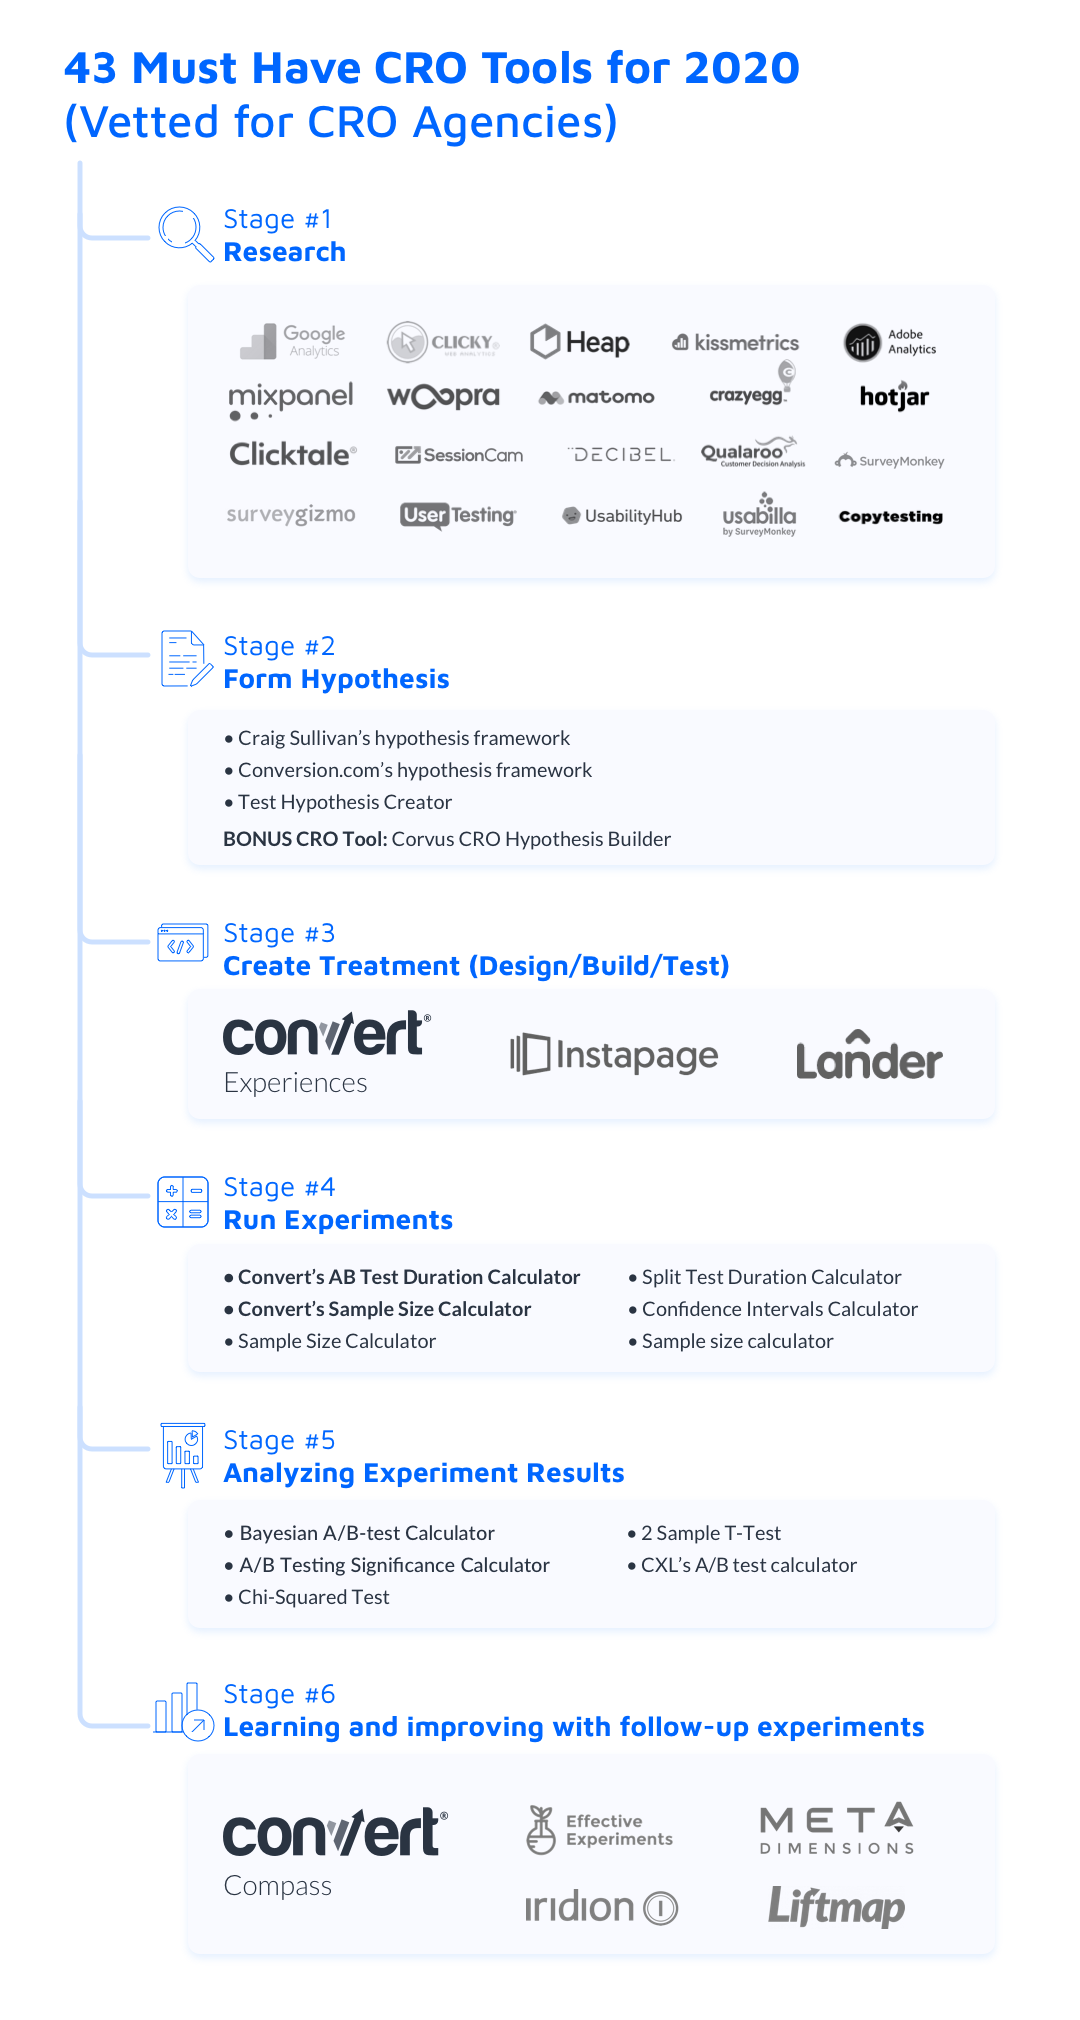
We have also compiled a list of the top 14 user testing tools that optimizers and experimenters use on the daily.
Did you know…
Convert Experiences integrates with 100+ of your favorite CRO & marketing tools?
Conversion Rate Optimization FAQs
What is a good conversion rate?
A: There is no accepted benchmark for a “good conversion rate”. The most you can find is an average from reports like the one by Unbounce.
The data is industry specific. It lets you understand how your assets are performing when compared to a broad average. However, once you are aware of this number, it is best to set your own conversion rate standards, based on your company goals and KPIs.
Which are the best Conversion Rate Optimization books for beginners?
A: We asked the CRO experts in the Journey Further Book Club to share the books that they found most helpful when they were learning the basics.
Here are their consolidated recommendations:
You Should Test That by Chris Goward
Whilst Chris Goward’s book is quite old now, its core principle that changes must be tested to be valid is timeless.
Web Analytics 2.0 by Avinash Kaushik
Avinash became a leader in the analytics world because of his ability to explain how to gather, read, interpret, and understand data. All essential skills for a CRO.
Experimentation Works: The Surprising Power of Business Experiments
Real-world examples of best-in-class CRO, featuring members of the Journey Further team.
A/B Testing by Dan Siroker and Pete Koomen
These guys went on to found Optimizely, but before they did that, Dan worked on the Obama election campaign and, with rudimentary tools, changed the world of experimentation forever.
Storytelling with Data by Cole Nussbaumer Knaflic
A beginner’s guide to learning how to visualize your data to tell a persuasive story on what needs to happen next.
The Journey Further Book Club is a community for time-pressured senior marketers and digital professionals. Please join the Journey Further Book Club community.
What are the best Conversion Rate Optimization groups to join?
A: Opinions vary because the simple act of joining a group of data-driven marketers and optimizers means you get exposed to different points of view and learn from the mistakes and the efforts of others.
The following are some communities that Converters frequent and find value in.
The CXL Facebook Group: Moderated by CXL. Great place to hang out and keep a finger on the pulse of what optimizers are focusing on.
Conversion World: This is hardcore optimization & experimentation. Members mean business when it comes to CRO. There are online events, virtual round-tables, and e-conferences for the analytics experts in the know.
COVIDCRAP: A bold move to offer aid to struggling businesses in the aftermath of the pandemic, #COVIDCRAP is a community of optimizers who are looking to conduct consultation sessions with businesses that need CRO assistance. They have a corresponding Slack group that’s full of success stories and hard wins. This one keeps it real.
CRO.Cafe: This one isn’t exactly a community, but it is fast becoming almost a movement. Hosted by Guido Jansen, CRO.Cafe is a conversational take on everything Conversion Rate Optimization, remote work, and overall business success.
What are the best Conversion Rate Optimization degrees to take?
A: There are several great Conversion Rate Optimization degrees and courses out there, but we are going to stick with the one most Converters opt to take.
It’s the gold standard in the world of optimization.
The Conversion Optimization Mini Degree Program by CXL Institute.
If you are worried about the price point, you can also look into the scholarship program that’s in place at CXL.